


Mean Sea Level
As global warming occurs, a direct reaction of the climate system is the sea level rise. This rise results from seawater expansion as a response to ocean heat uptake and addition of water from land-ice sheets and glaciers melting. Precise monitoring of the sea level rise is made possible using altimetry satellites that help understanding climate change and its socioeconomic consequences. The Global Mean Sea Level (GMSL) has thus become a key indicator of climate change.
Continuous altimetry observations from 1993 to the present have made it possible to establish an important climate indicator: the rise in Global Mean Sea Level (GMSL). Two main factors related to the current global warming explain this GMSL rise: the expansion of the ocean volume and the influx of freshwater from melting ice and glaciers. On the one hand, the global ocean absorbs more than 90% of the excess heat accumulated in the climate system as a result of rising greenhouse gas concentrations in the atmosphere; the average temperature of the oceans is therefore rising and seawater is expanding. On the other hand, the excess heat accumulated in the system causes the polar ice caps (Greenland and Antarctica) and mountain glaciers to melt. This meltwater contributes to the increase in ocean mass and thus to the rise in sea level observed by satellite since 1993.
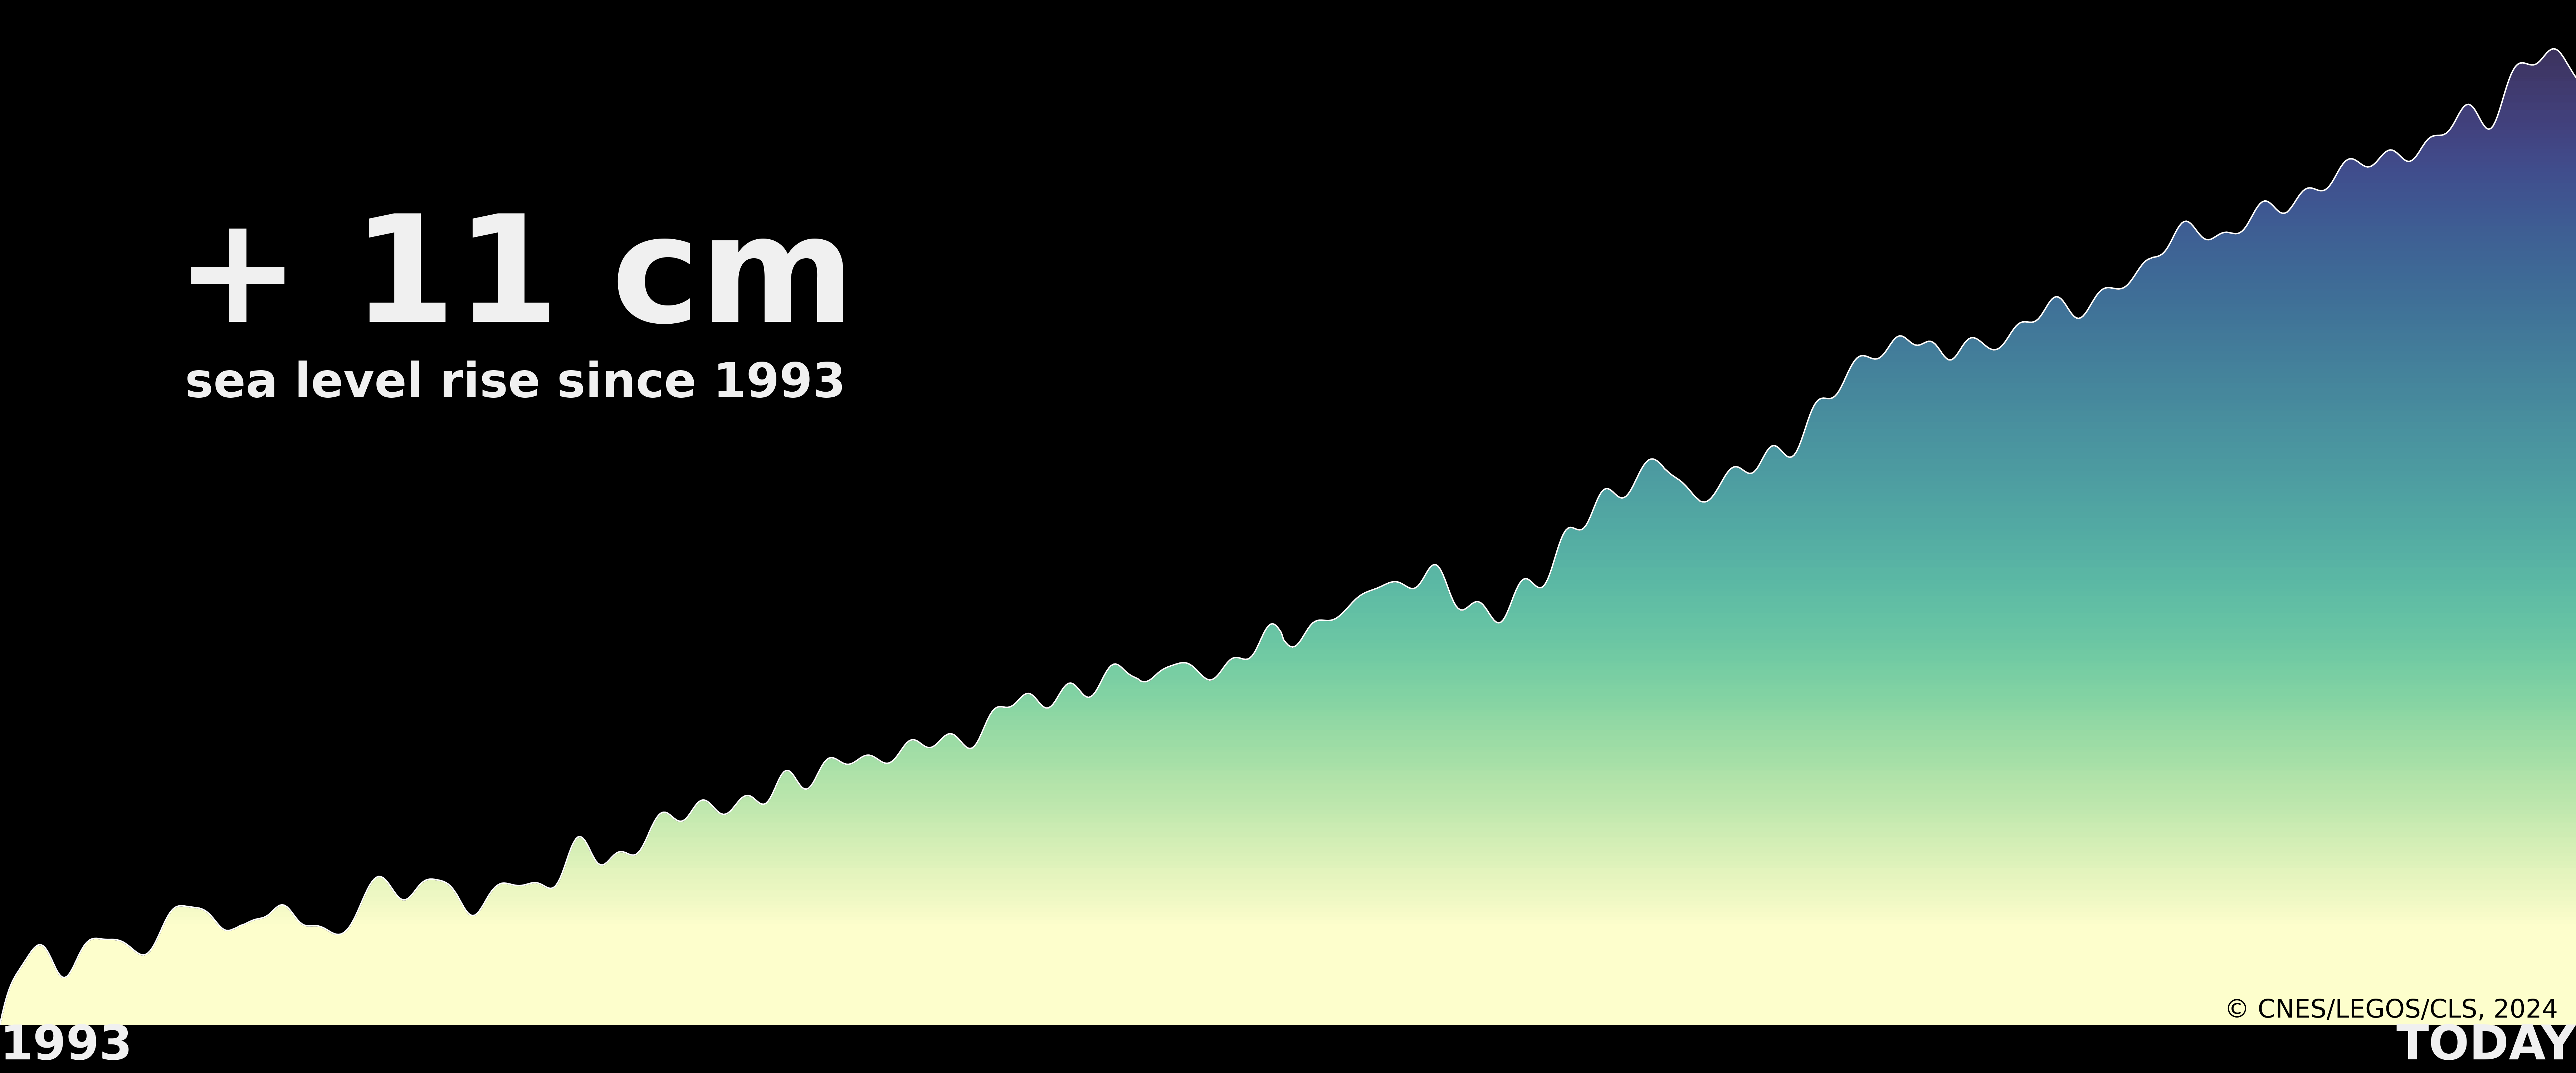
Since the beginning of satellite altimetry measurements in 1993, the GMSL has risen by more than 10 cm.
Data access and product information
 |  | |||||
Data access | Global scale | Regional scale |
AT THE GLOBAL SCALE
Different satellite altimetry missions have been monitoring the GMSL successively and continuously since 1993: TOPEX/Poseidon, Jason-1, Jason-2, Jason-3 and Sentinel-6 MF. These missions are called "reference missions" as they fly on a well-determined reference orbit that is unchanged since 1993. Dedicated calibration phases between the successive missions, during which the satellites fly a few second apart, help to ensure the long-term stability and precise monitoring of the sea level. In addition, a permanent control of the data quality and instrumental performances, in combination with the homogenization of the data processing and geophysical corrections , are key to produce homogeneous data that well capture the long-term evolution of the sea level.
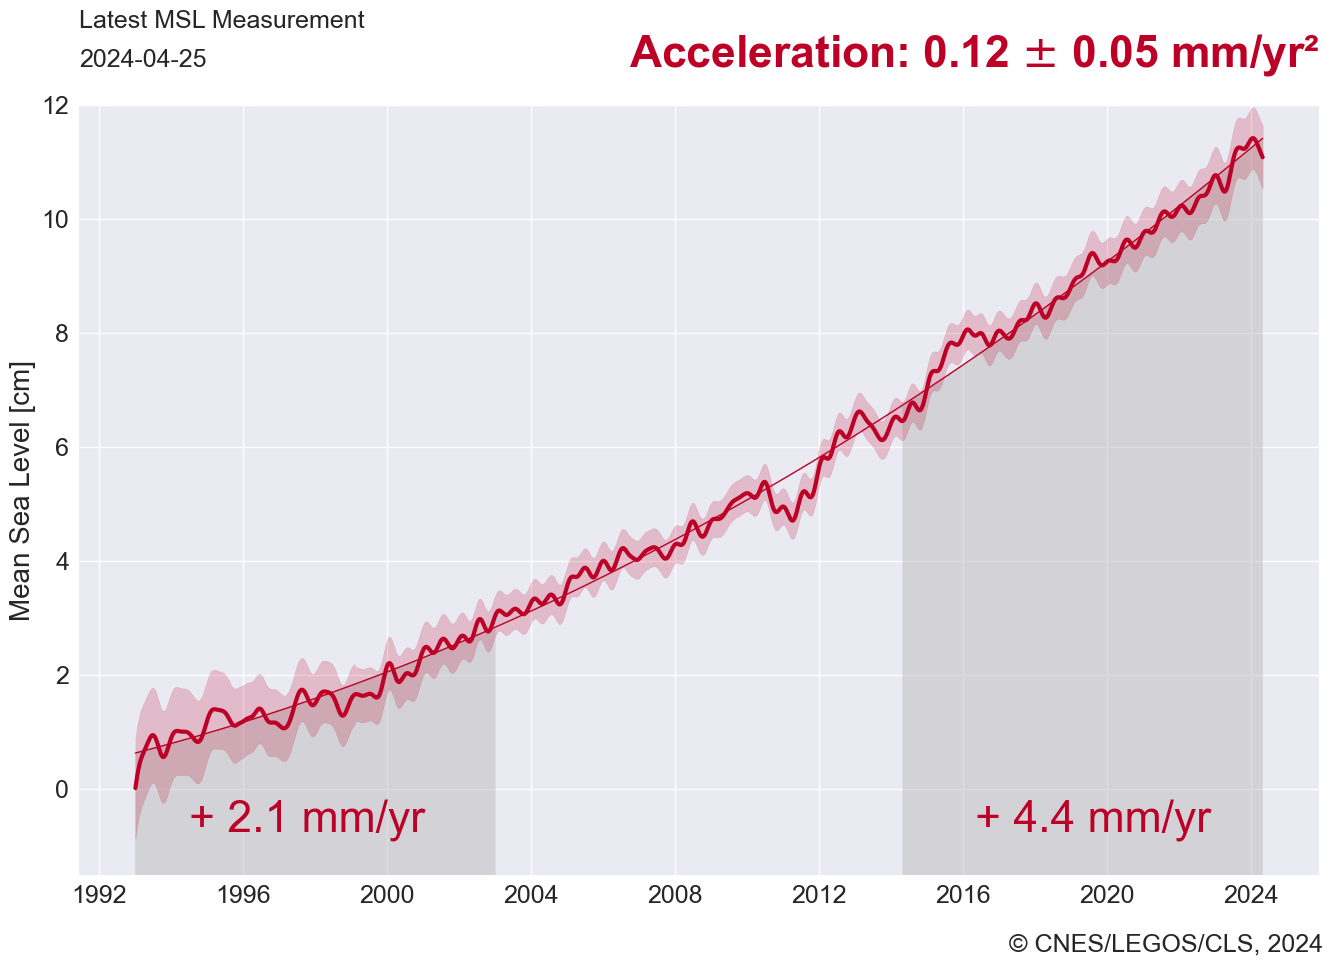
The sea level rise is averaging 3.6 mm per year (+/-0.3 mm/yr, 90%CI) over the globe and the entire altimeter record. There is also evidence that sea level rise rate is accelerating (eg Nerem et al., 2018, Guérou et al.,2023), over the altimeter record, this acceleration is estimated at 1.2 mm per year per deacade (+/- 0.5 mm/yr/decacde, 90%CI). Practically this means that rate of sea level rise has doubled from the 1993-2003 decade (2.1 +/- 1 mm/yr, 90%CI) to the 2013-2023 decade (4.4 +/- 0.5 mm/yr, 90% CI).Analyzing the uncertainty of the altimetry observing system yields to construct an uncertainty envelop for the GMSL climate data record (shaded area in the figure below, given at the 1 sigma level).See Guérou et al. (2023) for more details as well as the Validation page for some updates.
 |
An empirical correction of the TOPEX-A instrumental drift (Cazenave WCRP 2018) is applied. This correction is derived from comparisons between altimetry and tide-gauge sea level data (see more details in Validation). The TOPEX-A instrumental drift led to overestimate the GMSL rise during the first 6 years of the altimetry record.
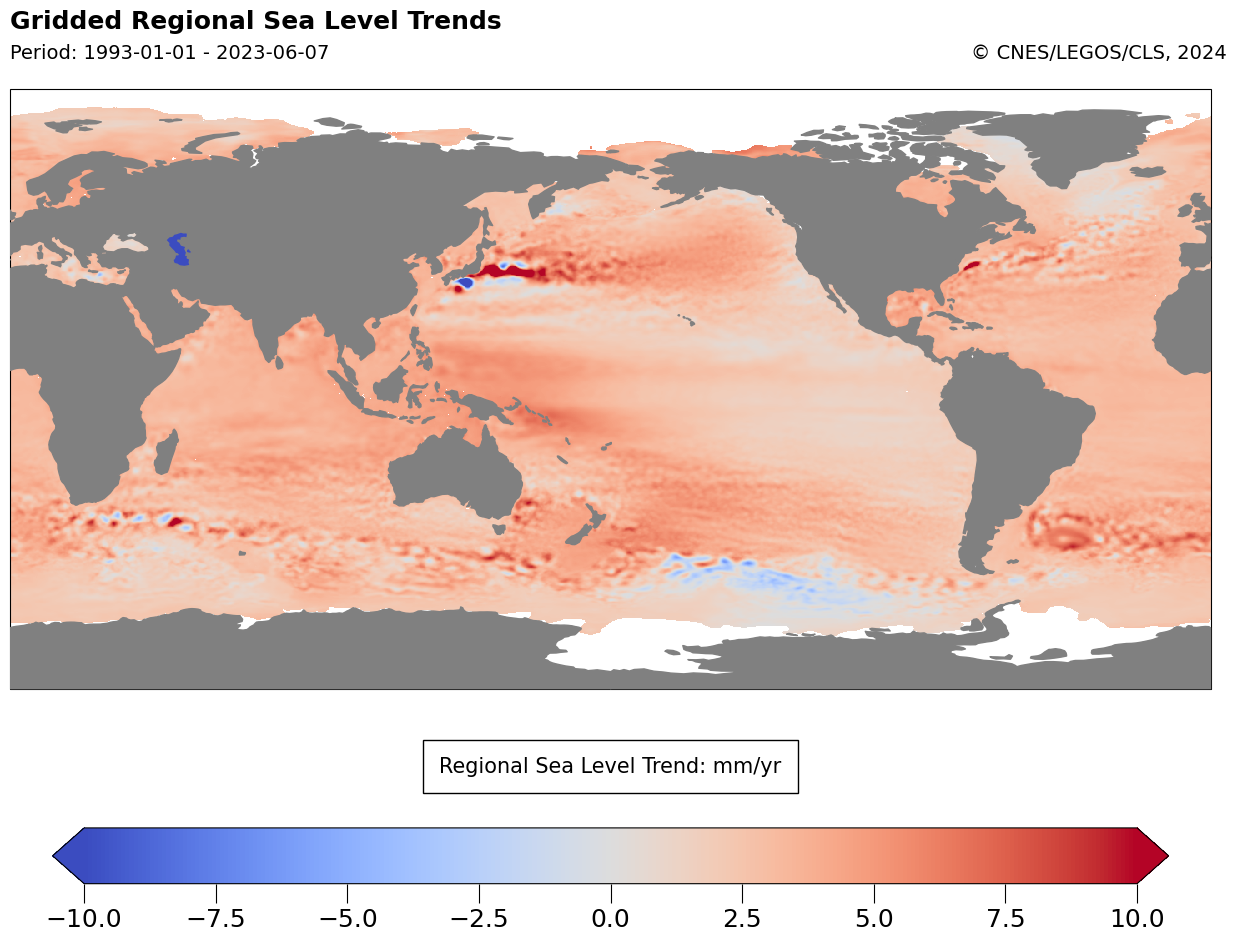
AT THE REGIONAL SCALE
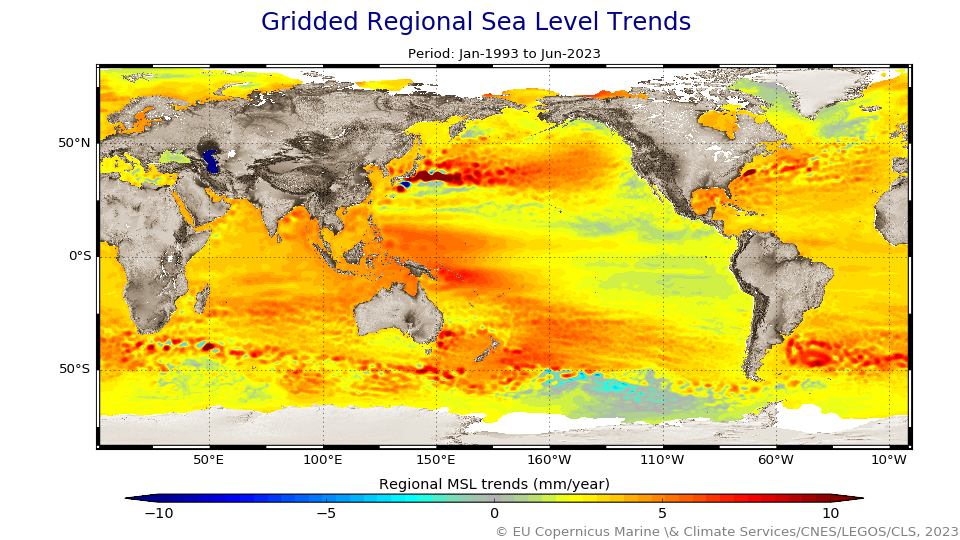
The GMSL curve masks significant regional variability in mean sea level, with some regions rising three times faster than the global average. This spatial variability is mainly due to the redistribution of heat under the influence of major climate oscillations, in particular the Southern Oscillation/El Niño, the Pacific Decadal Oscillation, and the North Atlantic Oscillation. Regional trends in mean sea level also reflect variations at different spatial scales, from large-scale structures in ocean basins to finer mesoscale structures in major currents such as the Gulf Stream, the Kuroshio, and the Southern Circumpolar Current (around Antarctica). Access to these regional dynamics is a major contribution of satellite altimetry to understanding and monitoring sea level variations, as a complement to tide gauges.
To compute the mean sea level at regional scales, auxiliary missions like SARAL/AltiKa, Envisat, ERS-1, ERS-2, Cryosat-2 and Copernicus Sentinel-3A are used in addition to the reference missions. This multimission approach allow to compute the Mean Sea Level at high latitudes (higher than 66°N and S) as well as to improve the products spatial resolution. See Ssalto/DUACS webpage for the processing details.
Further information on Regional Variability and past sea level reconstructions.
 |
Animation of the data since 1993
Satellite altimetry provides sea level related measurements continuously since 1993 all over the globe. This long-term monitoring allows the scientific community to estimate sea level rise at global and regional scales, and assess its impact on coastal vulnerable regions.