The tsunami detected by altimeters after the Tonga eruption
Image of the Month - February 2022


The violent volcanic eruption that took place on January 15th, 2022 in the Tonga archipelago, off the coast of their capital island, was followed by a major tsunami which propagated at about 800 km/h in the Pacific Ocean.
The eruption itself was observed by geostationary satellites, which animation captured the very fast propagation of the shock wave through the atmosphere, or by images of the ash plume created by the volcano. The optical data and the activation of the International Charter "Space and Major Disasters" also made it possible to measure the impact of the event on inhabited areas near the epicenter, and organise emergency rescue.
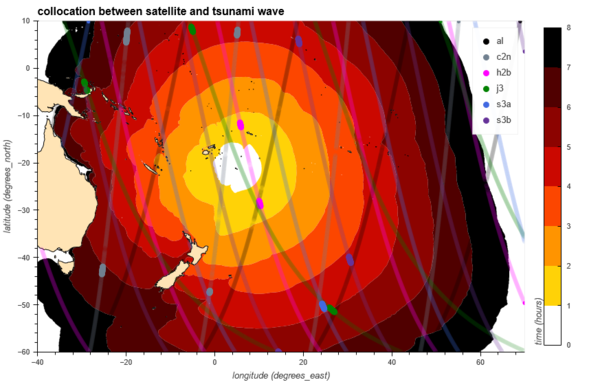
A less advertised spatial aspect of the event concerns the tsunami generated by the explosive eruption, and the importance of its observation by altimetry. The tsunami created by the Tonga eruption was indeed 'flashed' in multiple locations in the Pacific by the constellation of nine flying altimeters, and notably by the Chinese (HY-2) and European (Sentinel-3 and 6) operational programs. Although the measurements are much less spectacular than optical satellite animations, they are nonetheless essential for calibrating tsunami wave propagation models.
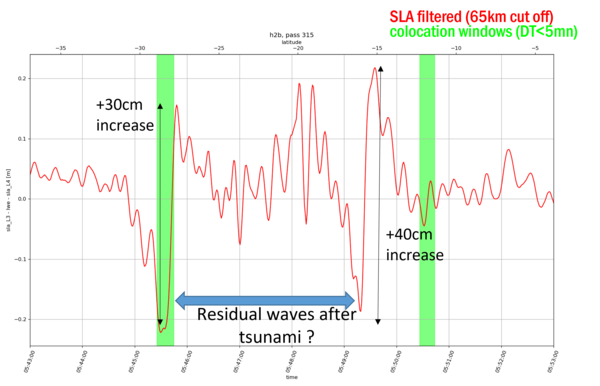
The Chinese HY-2B mission crossed the tsunami's double wavefront twice, around 1h30 after its departure from the volcanic epicenter. While the HY-2B satellite observation confirms the position predicted by the CEA model for the tsunami wave front to the north, there is a clear shift in the second wave front to the south: the model prediction is probably incorrect in this direction. In addition to measuring the position and amplitude of the initial wave, the altimeter also captures the rather complex rebounds in the wake of the tsunami.
This observation is important in the context of the warning systems developed to protect people and property in this situation. The areas near the epicenter are immediately affected, but early and reliable warning of remote areas requires a few hours of preparation and securing before the tsunami arrives. The warning system consists of numerous sensors distributed around the Pacific that detect the seismic event as early as possible, even in the open sea, and tsunami propagation models such as the one developed by the CEA. These models are essential for predicting the trajectory, speed and amplitude of the main tsunami wave.
Unlike the wave in the atmosphere, the tsunami does not propagate uniformly in all directions. In the open ocean, the amplitude is generally a few tens of centimeters and diminishes as the energy is dispersed. However, on arrival at the coast, the low bathymetry causes the wave to be amplified and the surge to be sometimes devastating, despite the thousands of kilometers separating the coast from the initial seismic event. Prediction models are used to identify exposed regions and assess the importance of the risk.
In this context, altimeter measurements are used to characterize the dispersion of the wave in the open ocean and to improve the physics of the models during propagation in the open ocean. Altimeters complement in-situ point data (e.g., tide gauges) by providing profiles of the main wave or its reflections.
Tsunami observation using altimetry and the link with prediction models emerged after the terrible disaster of 2004 when the wave caused the death of nearly 250,000 people as well as considerable material damage. The exercise is repeated for each major event, as in 2011 with the tsunami off the coasts of Japan, which affected the city of Fukushima in particular.
The 2022 tsunami is special because of its eruptive origin (the cause is not an earthquake, nor a landslide) and because the current altimetry constellation has multiplied the number of wavefront observations. While only a maximum of 4 satellites could observe in 2004, more than 20 profiles have been collected for the 2022 event. Their analysis by the experts will help understand the differences between the model prediction and the observation, as well as the wealth of residual waves (25 cm from crest to trough, 20 to 40-km wavelength) in between the two main fronts.
Acknowledgments:
- Anthony Sladen and Edhah Munaibari, Géoazur, for providing the modelled positions of the tsunami waves
See also:
- Applications/Geophysics: Tsunamis
including details on this event and the processing needed in The 2022 tsunami in the Pacific Ocean (Hunga Tonga volcano eruption)
Websites on this topic:
- CEA news (in French) for the propagation model
- Odatis-ocean (in French) for in situ tide gauge measurements
or Noaa Acoustics Program (in English)


