Higher resolution knowledge of flooded areas over the whole Earth
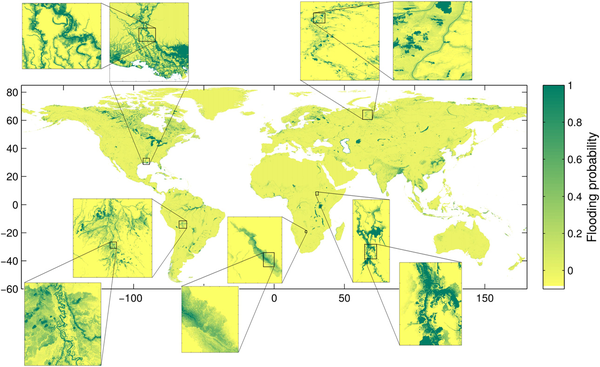
Swot will provide hydrology data at an unprecedented resolution over the whole world. That's well and good, but... if unprecedented, with what will those data be compared? Comparison is needed for both validation of the data and interannual studies that hydrologists will wish to begin as soon as possible.
To prepare for that, and because it is interesting in itself, a database of flooding probability has been built, and recently refined. The process starts from optical satellite imagery, directly showing water-filled areas (if there's no clouds) for a low resolution (0.25°x0.25°) first sketch. The database is then refined using microwaves and other visible and infrared satellite observations to determine topography at a resolution as high as 90 m (3 arc-second), month per month since 1993 and up to 2007 for now (to be extended further).
Wetlands are among the most sensitive environments, and their monitoring is therefore important for food and water security, climate change impact assessments, risk management. Swot will help when launched, but in the meantime, a better knowledge can be computed from the wealth of satellite observation already available, combining them in all possible ways.
References:
- Aires F., L. Miolane, C. Prigent, B. Pham-Duc, E. Fluet-Chouinard, B. Lehner and F. Papa (2017), A Global dynamic and long-term inundation extent dataset at high spatial resolution derived through downscaling of satellite observations, J. Hydrometeor., Volume 18, No. 4, April 2017

