Circumpolar velocities
Lively Data : April 21, 2006
Antarctic Circumpolar Current (also known as "ACC") is the strongest current of the globe.
Among Live Access Server datasets, geostrophic velocity anomalies are available as vector maps or only with their zonal/meridian components; such data are an accurate reflection of this oceanic phenomena.

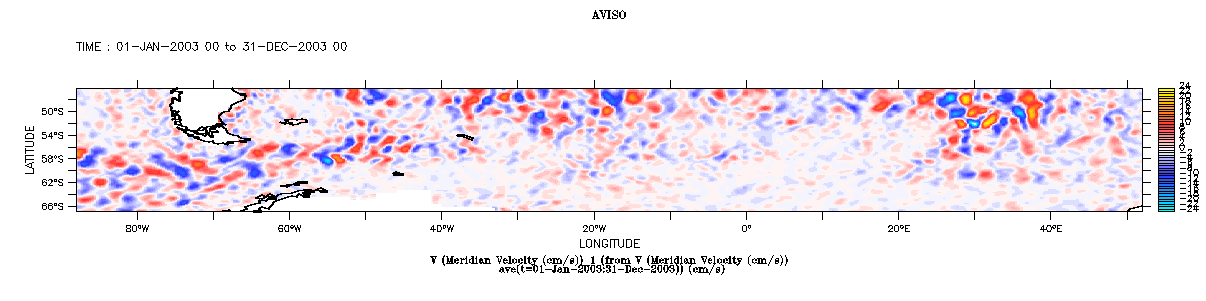
Zonal and meridian components of geostrophic current, 1 year-mean, Antarctic circumpolar area. Select "Ssalto/Duacs near-real time Absolute Geostrophic Velocity" dataset, then U (or V) variable; In the "Define variable" menu, choose "average" for "Select analysis type", "t" and (January 1st, 2003 - December 31, 2003) for data period. The geographic area we defined is (46°S-67°S, 88°W-52°E), and the color palette is the "anomaly" one.
Circumpolar current is depicted by:
- a "spreading out" trend for U values, which shows the general courant,
- a contrasting changes between strong positive values (in red) and low negative values (in dark blue), especially for V component, which are the signature of Antarctic Circumpolar Current, where an intense mesoscale variability occurs. But to increase our knowledge of this mesoscale varibility it is of course better to evaluate EKE parameter (see Lively Data, December 15, 2005 : About Eddy Kinetic Energy).
 Use the Live Access Server

