Mean Dynamic Topography
Current relief
The major ocean currents generated by prevailing winds are deflected from their course by the shoreline, and by the Earth's rotation. Ocean circulation thus causes water to accumulate at the western edge of ocean basins.
Large scale ocean currents flow along the lines of equal dynamic topography. In the northern hemisphere, the flow is clockwise around the topography highs. In the southern hemisphere, the flow is counter-clockwise.
By measuring sea level variations, altimetry satellites enable us to observe ocean currents.
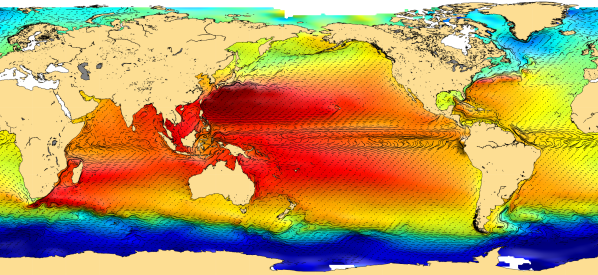
Dynamic topography and ocean currents viewed from space
This mean circulation is not an immediate product of altimetry data. Those data give more the mean sea surface, which contains the marine geoid plus the sea elevation due to the mean oceanic circulation. So we have to combine altimetric data with others (in-situ, gravimetric satellites...), to precisely determine the geoid, and by substracting it, compute the mean circulation. This dynamic topography shows all the features of the general circulation with gyres and associated western boundary currents (e.g. Gulf Stream, Kuroshio, Brazil/Malvinas Confluence area).
Variability of ocean circulation
The world's oceans are subjected to many movements and variations. These movements are a lot "livelier" in some regions than others, chiefly in the strongest currents near the western seaboard of the oceans, such as the Gulf Stream in the North Atlantic, the Malvinas Current in the South Atlantic, the Kuroshio Current near Japan, and the Agulhas Current in the Indian Ocean, south of Madagascar. The strong variations in these zones are caused by intense eddying generated by instabilities in these powerful ocean currents. Sea level variations in the vicinity of these currents, caused by eddies tens or hundreds of kilometers across, can be as much as 30 centimeters. The Antarctic Circumpolar Current is another highly energetic current unbounded by any continent.
On the other hand, there are zones on either side of the Equator that hardly vary at all. Other intermediate zones exhibit phenomena that are more intermittent than ocean currents. The El Niño phenomenon in the Equatorial Pacific Ocean is a good example.
Satellites provide a global picture spanning several years to help us monitor these ocean variations more closely.
Further information :
- Mean Dynamic Topography on Google Earth (Download the kml file and open it in Google Earth).
- Image of the month, January 1999 : A glassy sea... of ridges and valleys.
- Lively Data, June 17, 2005 : Gulf Stream and Kuroshio.
- Data : Combined mean dynamic topography .

