Variations on MDT
Lively Data : July 13, 2005
We saw last month (cf "Kuroshio and Gulf Stream") ocean circulation in the North Pacific and North Atlantic areas by mapping variance of Sea Level Anomalies (SLA).
Basically, choice of SLA - instead of Absolute Dynamic Topography (ADT)- is due to its availability in low resolution: otherwise computing variance in high resolution for a large area over several year is too long for the LAS. And by definition, at a given date:
ADT=SLA+MDT
For example, here are three maps plotted with LAS on December 8, 2004, respectively dynamic topography, sea level anomalies, and errors on these anomalies:
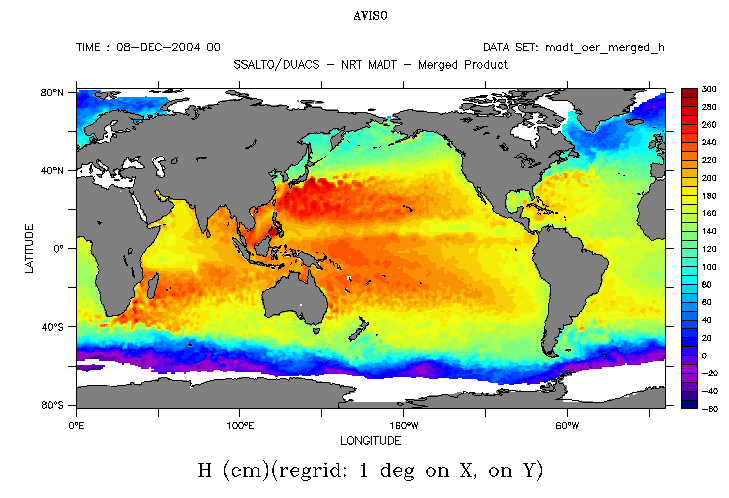
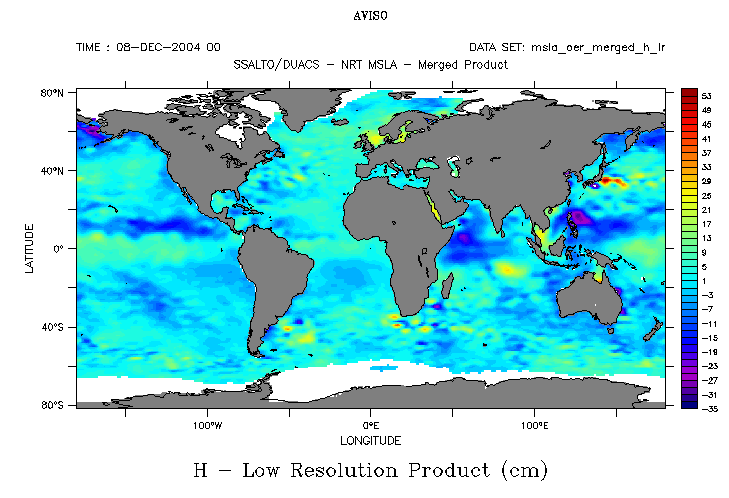
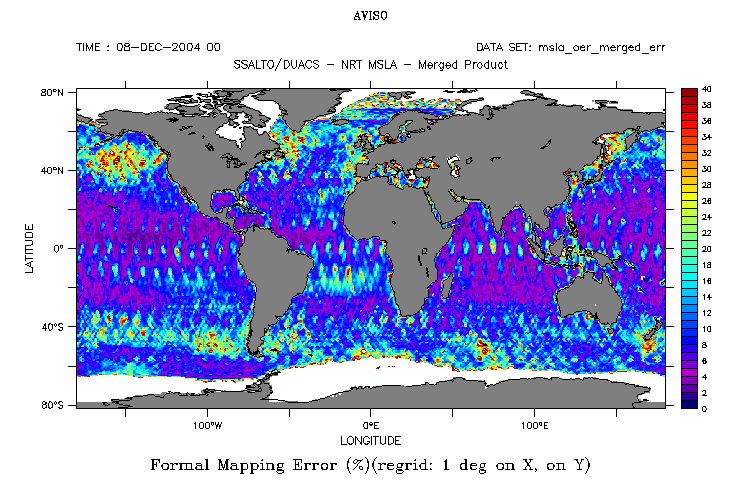
Absolute dynamique topography (merged data), sea level anomalies (merged data) and formal mapping error on SLA on December 8, 2004. Formal mapping error for merged data is accessible when choosing "NRT-SLA" as dataset; this map is also representative of errors made on ADT. We can opt for a map with no contours when writing (0,0,0) in "contour levels" option via "output options"; concerning color scale, it is possible to modify (minimum value, maximum value, step) in "fill levels" still available in "output options".
In the same way, on June 8, 2005:
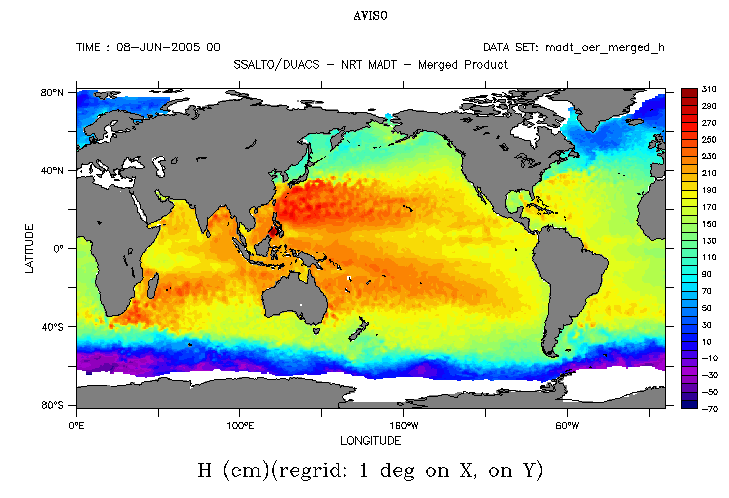
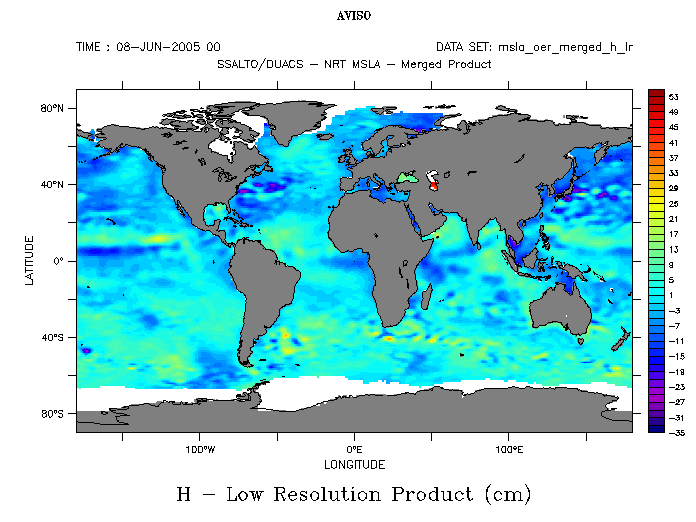
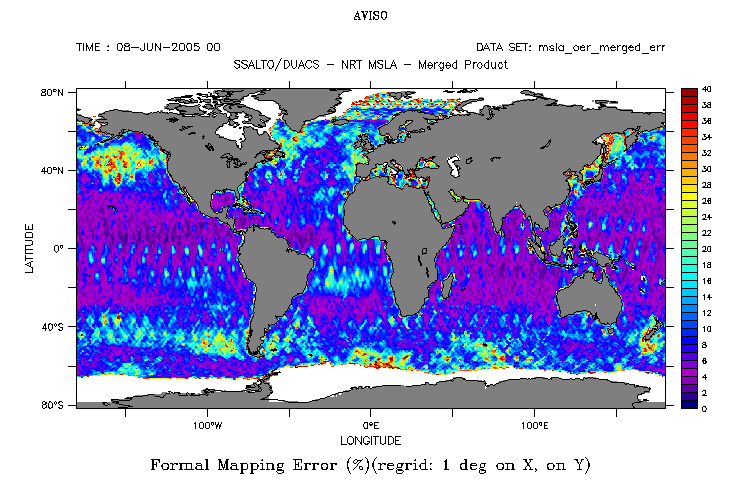
Absolute dynamique topography (merged data), sea level anomalies (merged data) and formal mapping error on SLA on June 8, 2005.
These series of maps have something in common, it is Mean Dynamic Topography (MDT):
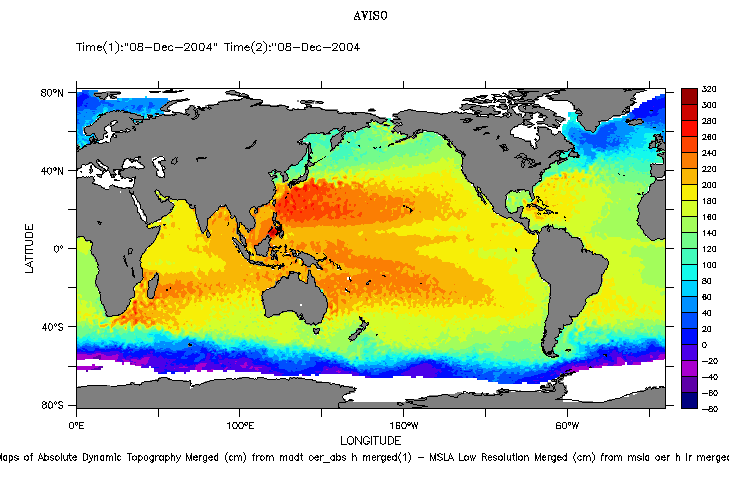
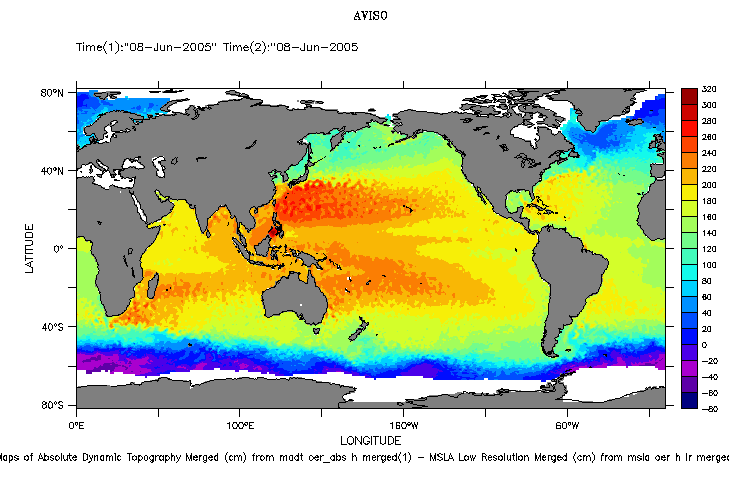
Mean dynamic topography (i.e ADT-SLA) computed respectively on December 8, 2004 and on June 8, 2005.
We used "compare two" option, then we defined suitable datasets and dates, and finally choosed "comparison plot".
MDT represents the stationnary component of total current, so MDT is still the same from a date to another.
Thus, about oceanic variability,
var(ADT)=var(SLA)+var(MDT)=var(SLA)
 Use the Live Access Server

