About ocean variability
Lively Data : May 09, 2007
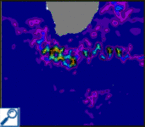
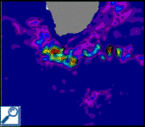
The Agulhas system is an area of intense variability (see on this subject Day by day, the Agulhas Current); ocean variability can be quantified by some statistical indicators as variance, that has the advantage to be very simply accessible via the Live Access Server.
Mesoscale variability is better described by a multi-mission configuration (fig.3); note also that some recent studies outlined that a minimum of two altimeters is needed to observe mesoscale features in delayed time mode (that is the case here), and three to four are needed to obtain the same accuracy in near real time.
In LAS datasets main menu, select "SSALTO/DUACS delayed time Maps of Sea Level Anomalies" and then "Maps of Sea Level Anomalies Jason", finally define your geographic area. Choose the "define variable" option, and select "var" in the menu. The variance is computed on a 6 months period, from June 04th, 2003 to December 31th, 2003. Follow the same way to plot the map with merged product. To compute and plot the difference between the two maps, select the "compare two" option.
![]() Use the Live Access Server
Use the Live Access Server


