Drawing formal mapping error maps
Lively Data: May 19, 2009
In Near Real-Time, the Live Access Server gives access to Maps of Sea Level Anomalies for each altimeter mission with its formal mapping error. These maps are expressed in percentage of signal variance and allow to estimate the relative errors made by the mapping process. Recently, the LAS also integrates the NRT Jason-2 products.
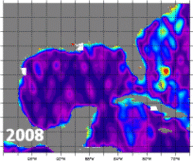
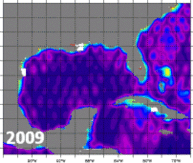
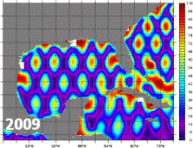
A comparison on maps of merged SLA before/after the Jason-2 integration shows a formal error decreasing with the Jason-2 contribution. A second comparison on maps of SLA with/without merged data shows the large benefit provided by the multi-satellite configuration.
Maps of SLA Formal Mapping Errors expressed in % for merged data (left and middle) and Jason-2 monomission data (right). From left to right, maps date from April 2008 -before the Jason-2 integration (left) and from April 2009 -after the Jason-2 integration (middle and right). To plot such a map, you have to select the dataset NRT - Global - (Maps of) Sea Level Anomalies And Formal Mapping Error and Maps of Sea Level Anomalies Merged (or Maps of Sea Level Anomalies Jason-2), choose the dates and define a common color fill levels (0,100,2)(110).
Further information:
- Formal Mapping errors on Ssalto/Duacs
![]() Use the Live Access Server
Use the Live Access Server


