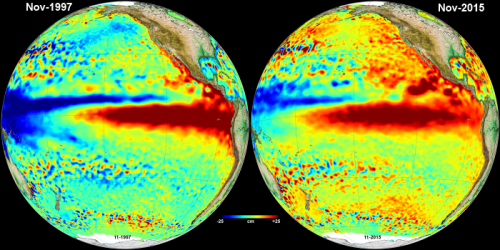
El Niño and La Niña in a nutshell:
In the tropical Pacific, the interaction between the ocean and the atmosphere is responsible for the biggest natural climate phenomenon in the world: the El Niño Southern Oscillation (ENSO), which occurs every 2 to 7 years. El Niño is the warm phase of ENSO. During El Niño, the surface of the water in the central and eastern tropical Pacific is warmer than average. An El Niño event is associated with a typical weakening of surface winds that blow from east to west along the equator. The opposite phase, called La Niña, is when the sea surface is colder than average in the tropical Pacific and easterly surface winds become stronger. Changes in the ocean and atmosphere during El Niño and La Niña events have a big effect on local weather patterns in Southeast Asia and Oceania, the tropical Pacific, South of America and other regions of the world. Both El Niño and La Niña events are also closely linked to important social and economic issues. They can have severe environmental and human consequences when they are at their strongest.

Monthly mean of Sea Level Anomalies (in cm) over the Ocean Pacific as computed for the El Niño indicator (annual and seasonnal cycles removed). Download enlarged images from the Gallery. Credits CNES/EU Copernicus Marine Service.


