An ocean circulation data indicator
Lively Data : March 27, 2006
New Aviso gridded multi-missions data are available: Maps of Absolute Dynamic Topography (MADT) were reprocessed using a new mean dynamic topography Rio05.
Because MADT are computed using MADT = MSLA + Rio05, you can easily obtain a Rio05 map using LAS, see the method with the Lively Data : What's behind "MADTs"?
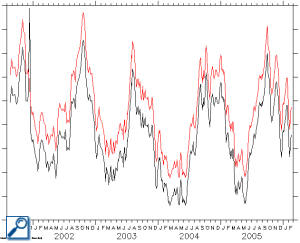
Here we just try to quantify the difference between the older dataset and the new one with LAS.
One-year mean of Absolute Dynamic Topography, North Atlantic region. Select NRT-MADT merged dataset (the only one still available on LAS), geographic area (enter 0°N-70°N, 20°E-80°W or pick "North Atlantic" in Select region menu); select "define variable", "average"- those statistic operation is defined by défault, then x and y. Clic on next, define data period, here we plotted mean absolute sea surface heights from february 05, 2005 to february 04, 2006.
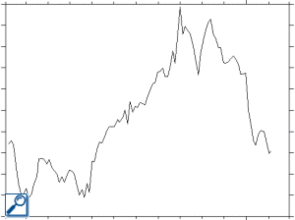
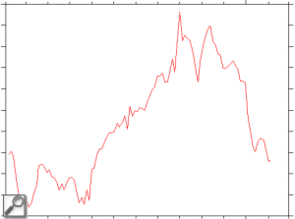
On such an example differences between datasets are not obvious because the plots look the same, but differences are there when considering the values. On specific areas these differences can be more significant, for example following Gulf Stream current:
![]() Use the Live Access Server
Use the Live Access Server


