
Altimetry helps link bits and pieces of a current together
Image of the month - October 2004
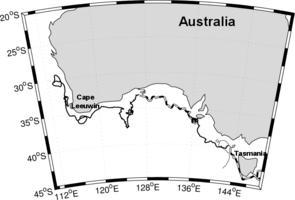
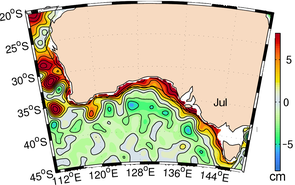
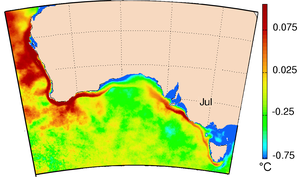
"Extended" Leeuwin current as seen by drifting buoys (left; several of them were used to plot this map) and monthly Sea level anomalies, right, in July (austral winter): the current flows continiously between West of Australia and Tasmania.
(Credits CSIRO Marine Research).
Currents have been observed for a long time by mariners. The first record of a scientist measuring such an ocean feature (the Gulf Stream) is Benjamin Franklin in 1777. But for years, the view was at sea level, and so was fragmented.
Piece by piece, oceanographers began to put together the ocean circulation puzzle. With developments in space technics, especially satellite altimetry, an elevated view became possible, allowing new pieces of the world's oceans to be filled in.
One such example is Australia's Leeuwin Current. For years, three "currents" had been identified and named west and South of Australia; the Leeuwin Current (southwards, west of Australia), the South Australian Current (eastwards up to Tasmania, south of Australia) and the Zeehan Current (southwards, along the Tasmanian coast). However, use of altimetry measurements helped in proving that those features were part of a unique current following the Australian coast. Such a current, the longest coastal current identified in the world, has an important impact on local climate, sea biology and navigation.
Websites on this subject:
- At 5,500 kilometres, the Leeuwin is our longest ocean current (CSIRO Marine Research)
- Australasian ocean currents (CSIRO)
References
- Ridgway, K. R., and S. A. Condie, 2004: The 5500-km-long boundary flow off western and southern Australia, J. Geophys. Res., 109, C04017.
Further information:
- W. Han et al., OST/ST 2008 meeting, Interannual variability and decadal change of thermocline depth and upper-ocean heat content in the Indian Ocean. pdf.

