Changing scale in eddy observation
Image of the Month - September 2024

In the early days of oceanography, oceanic currents were depicted on maps in a simplified, schematic manner. However, as research progressed, their turbulent dynamics began to emerge through the use of oceanographic cruises and in situ measurements. These observations were made prior to the advent of satellite altimetry, which demonstrated the ubiquity of these currents in the whole Ocean, exhibiting varying magnitudes in all locations.
Since the early 1990s, altimetry satellites such as Topex/Poseidon, Jason-1, 2 & 3 or Sentinel-6 Michael Freilich, combined with ERS, Envisat, Sentinel-3, Cryosat, Saral and/or HY-2, have enabled to census more than a hundred of thousands eddies. Lasting from a few weeks to more than a year, these eddies are observed in sea surface height anomalies data as reliefs (highs or lows) of 10 to 100 cm However, even when data from a dozen different classical altimetry satellites are combined, it is not possible to observe eddies with a diameter of less than 100 kilometers. Nevertheless, other techniques, such as satellite SST or ocean color, or buoys (in particular satellite-located buoys), have demonstrated the existence of smaller eddies.
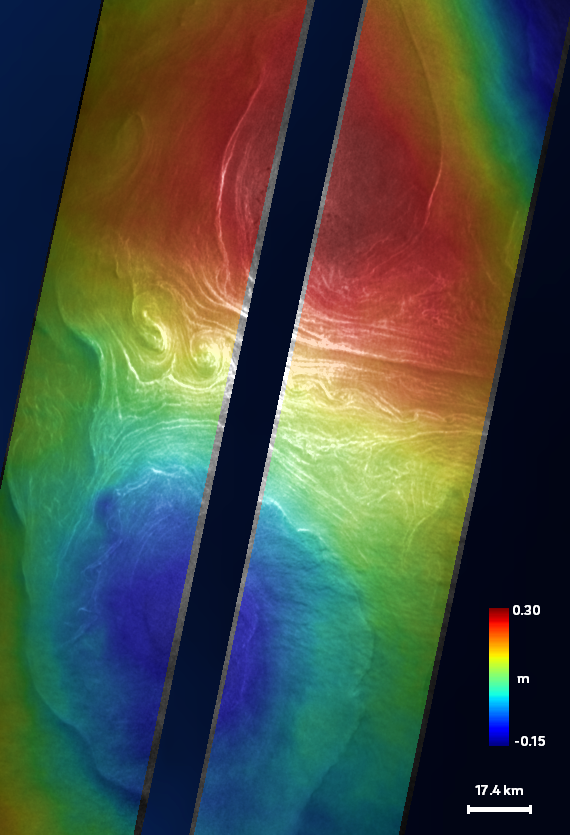
The high resolution and wide swath of the Swot's main instrument KaRIn, developed by Nasa/JPL and Cnes, enables the observation of eddies ten times smaller than previous altimetry missions (down to 10-20 km wide), and even some smaller (submesoscale) oceanic structures than anticipated. This new vision of the oceans should facilitate a deeper understanding of the role of submesoscale circulation in the climate, as well as the relationship between these small-scale phenomena and ocean currents. Furthermore, it should enable the study of the creation of favorable environments for marine species, thereby advancing our knowledge of ocean circulation.
See also:
- Missions: Swot
- Applications: Mesoscale circulation
- Applications: Submesoscale circulation


