Altimeters chart sea level
Image of the Month - May 2008
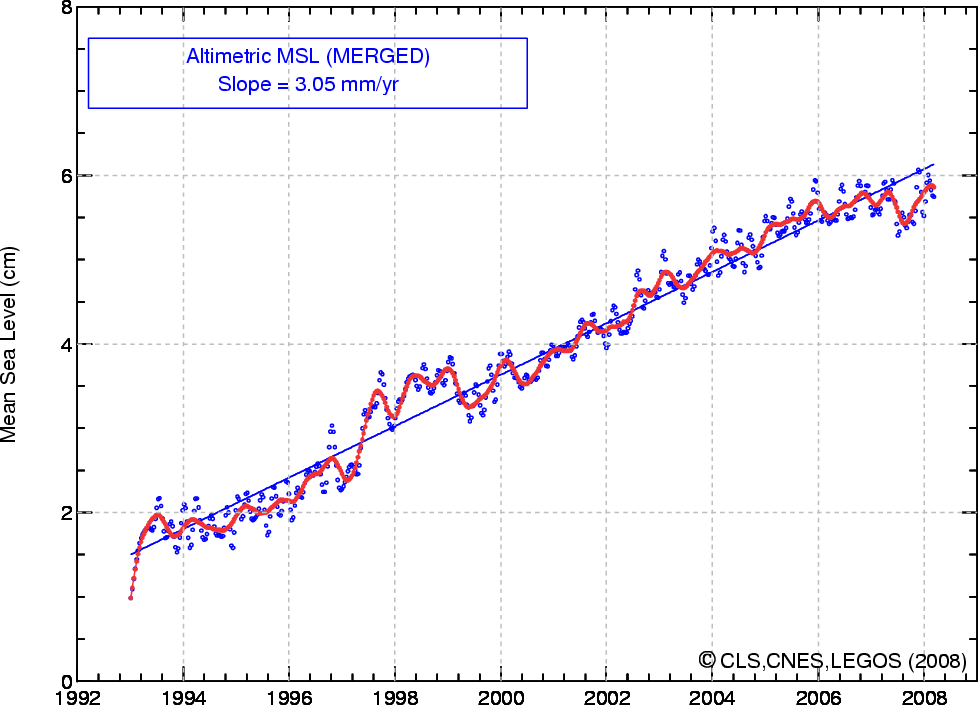
Altimetry measures sea level over the open ocean. Between 1993 and 2008, global mean sea level rose of an average of 3 mm/yr, a value definitely higher than what was measured by tide gauges during last decades. It also showed that the rise is not the same everywhere: in some regions, such as West Pacific, the rise is much higher than average. In other places, such as East Pacific, the sea level decreased.
Sea level varies in react of the complex evolution of several climate system components (oceans, polar caps, mountain glaciers). It is also sensitive to hydrologic cycle modifications linked to ground water pumping, construction of dams over rivers, irrigation, deforestation, urbanisation, etc. Over the 1993-2003 period, ocean warming account for about 50% of the observed sea level rise, the remaining being induced by mountain glaciers melting (30%) and fast run-off of Greenland and West Antarctica coastal glaciers (20%).
Since about 2006, the sea level evolution curve is staying level. However, several phenomena, like La Niña, can explain this observation (which has already been done around 1998-2000). And, anyway, two years is much too short a period to evaluate a trend for a climate phenomenon.
Altimeters have been providing global mean sea level measurements since October 1992. This is giving an estimation of the trend in mean sea level, but is only a little more than half the time defining a climatologic period (namely, 30 years is what is considered as a climatic period). Thus continuing the measurement series, with Jason-2 and afterwards the satellites that will take over (Jason-3,...), is of foremost importance to understand and predict the sea level variation trends.

See also:
- Ocean indicators : Mean sea level
- Data: MSL images and dataSsalto/Duacs multimission altimeter products
- Applications: Mean sea level rise
- May 2008: Altimeters charts sea levelAltimetry applications in videos: Mean Sea Level

