Icebergs on the move
Image of the Month - September 2013
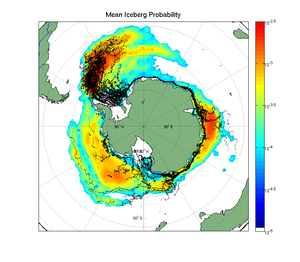
Probability of presence of small iceberg (between 100-m and 3-km length) computed from the whole series of altimeters since ERS-1. The black lines present the paths of the large icebergs (length over 6 km) as tracked by the Bringham Young University. The movie presents the icebergs detected every month between 1993 and 2013 (black dots) as well as the mean monthly extent of sea ice.(see the animation in .avi, 5 MB) (Credits Ifremer)
Icebergs are a hazard for navigation, and an important piece in the climate puzzle. Flocks of icebergs can also significantly attenuate the sea state in the Southern Ocean.
Having twenty years of altimetry enables to compute statistics on icebergs, using the method described in the Image of the Month for November 2008 (the fact that an iceberg, being higher than the surounding ocean, reflects back the radar wave before the main oceanic background). Using the full series of available altimetry satellites (ERS-1, ERS-2, Topex/Poseidon, Jason-1 and 2, Envisat, Cryosat) a climatology of icebergs shed by the Antarctic continent has been computed. The three main areas of icebergs concentration corresponding to the three main gyres of the Southern Ocean circulation are clearly seen. In the South Atlantic, where large icebergs are regularly caught in the Antarctic Circumpolar Current (the "iceberg alley") small icebergs travel far North (up to 50°S). In the other oceans, the presence of small icebergs North of 60°S is more sporadic and corresponds to large icebergs caught in the Antarctic Circumpolar Current.
With now Saral flying and measuring, the statistics will be continued, improving our knowledge of both icebergs moves and how Antarctica is shedding them.
See also:
- Image of the Month, November 2008: Counting icebergs
- Applications: Ice sheets and sea ice
- Data: Waveforms
Other website on this subject:
- the database used to produce those plots are available throught Ifremer's Cersat center, at ftp://ftp.ifremer.fr/ifremer/cersat/products/gridded/altiberg/

