Envisat measures up Antarctica
Image of the Month - October 2010
Antarctica is certainly the most inhospitable continent on Earth. Cartographic expeditions there are very hard, restricted by the environment harshness, and even impossible in Winter. Satellites, and especially altimetry satellites, on the other hand, don't have such limitations. Envisat, which takes measurements up to 81.5° North and South, in the wake of ERS-1 and ERS-2, and now Cryosat, enable to estimate ice caps topography.
With several years of Envisat data now available, topography variations from year to year can be observed. West Antarctica glaciers, in particular, are thinning. Change over larger areas are also measured, thinning or thickening, over several years. Long series of observation are thus necessary in this case also, to discriminate between interannual variations and long-term changes.
Saral and later on Sentinel 3 will take over the measurements on Envisat orbit, thus delivering data over a time span of twenty years or so.

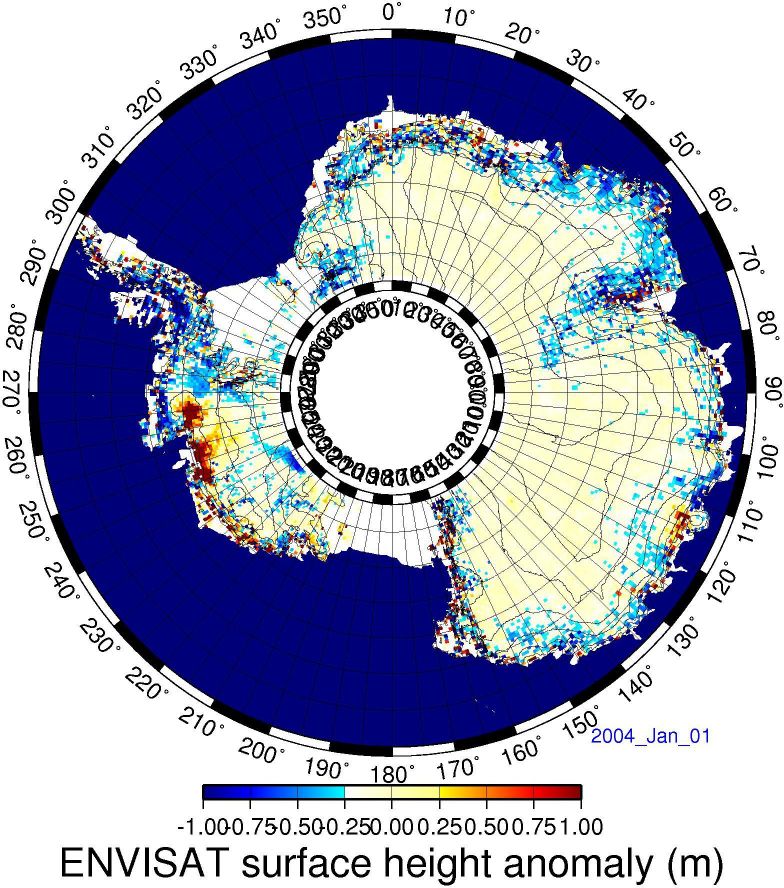
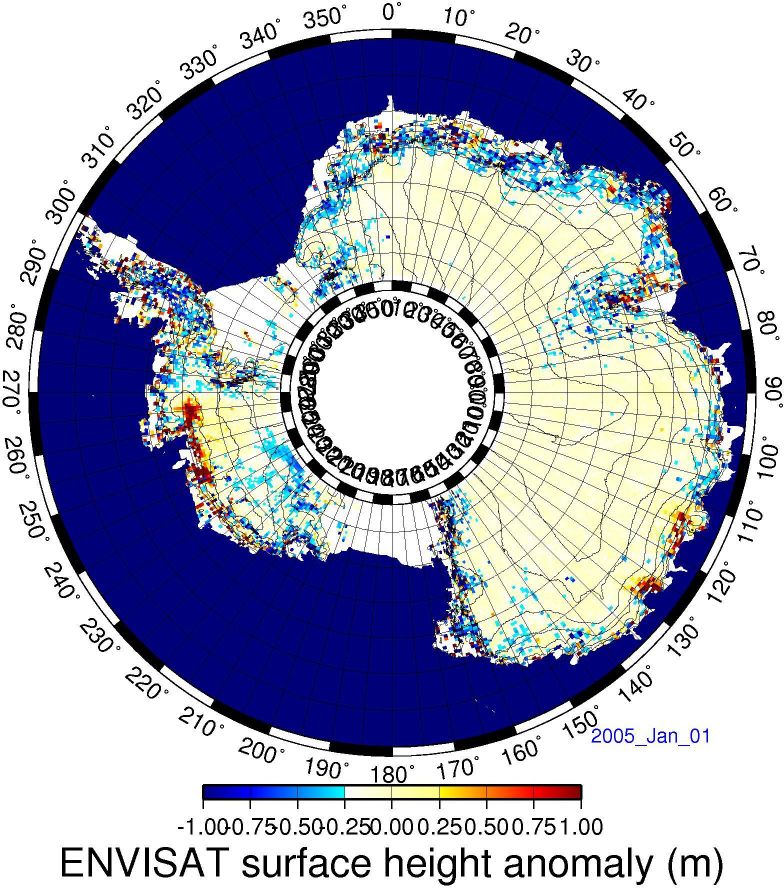
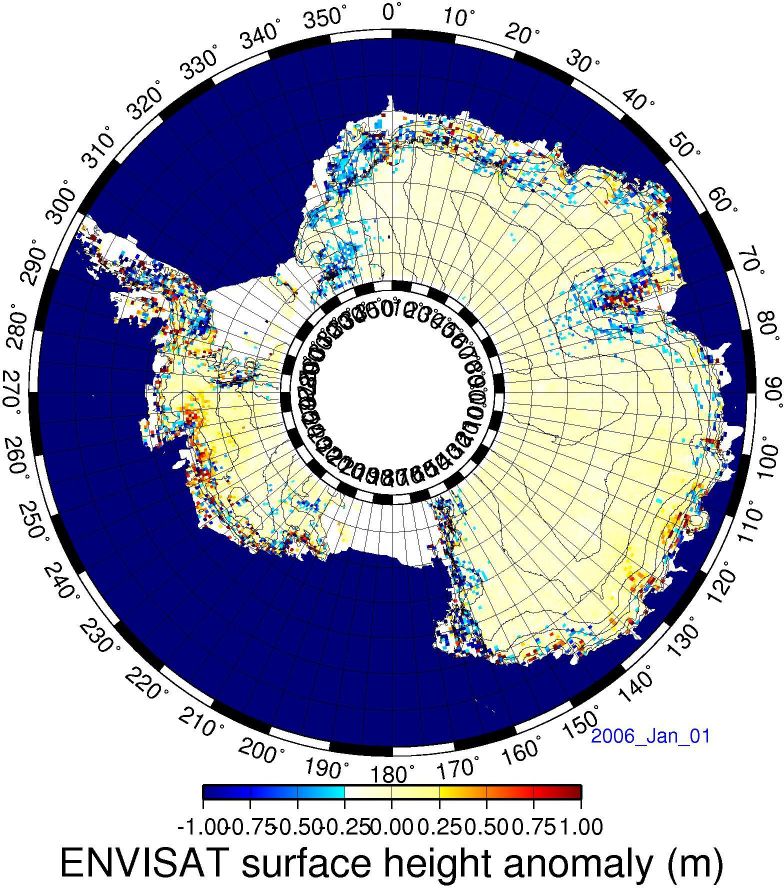
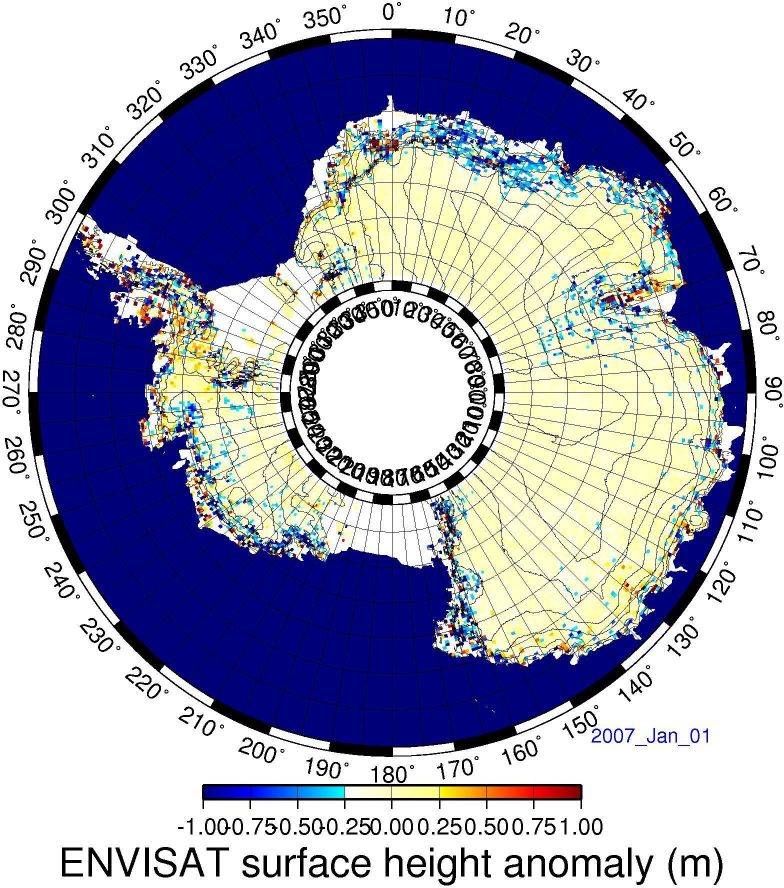

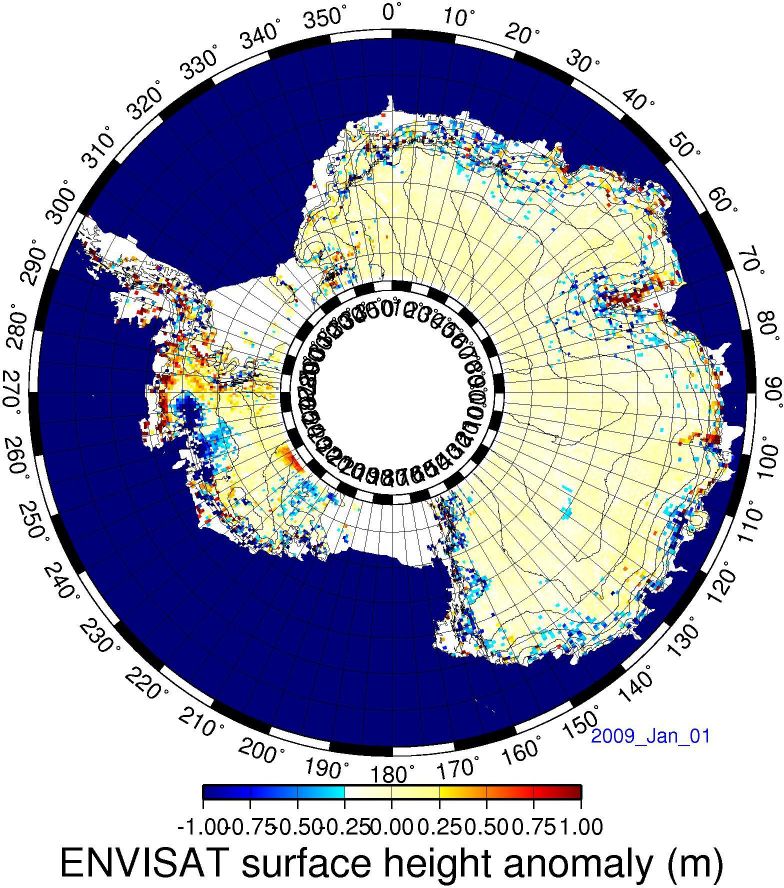
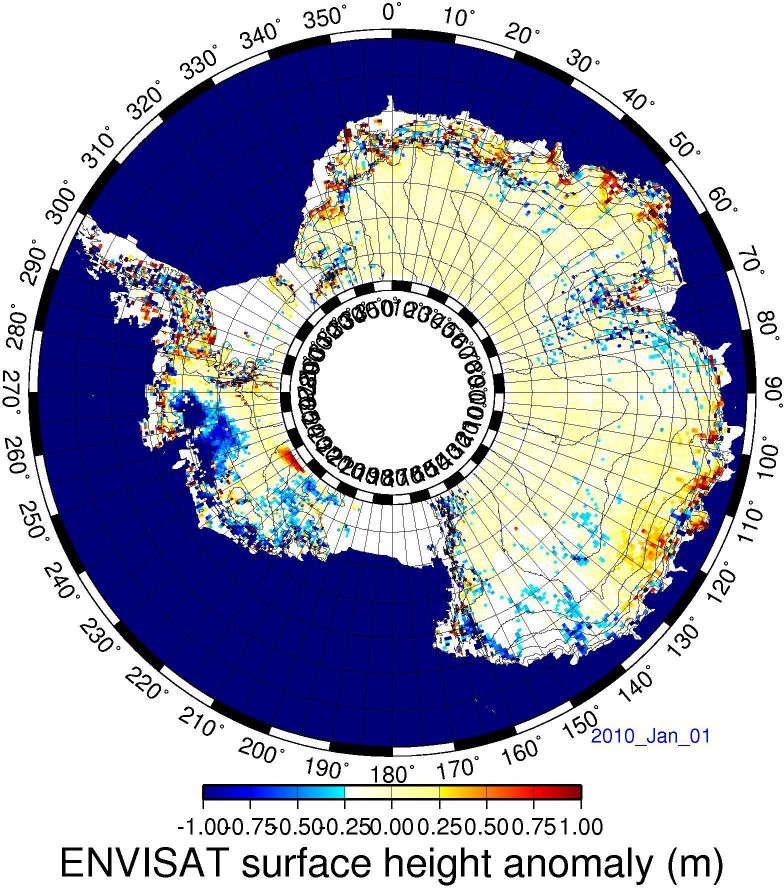

![]() Antarctica topography variations as measured by Envisat for the 1st of January of each year since its launch. Note that the West of the continent saw quite high variability over the years.
Antarctica topography variations as measured by Envisat for the 1st of January of each year since its launch. Note that the West of the continent saw quite high variability over the years.
See the animation (one map every January (Flash, 460 KB) ; One map every day (mp4, 10MB)) (Credits Legos/CNRS)
See also:
- Applications: Ice sheets
- Image of the Month, April 2000: Rivers of ice in Antarctica
- Image of the Month, August 2000: A lake capped by ice
- Data: Geophysical Data Records
References:
- Legresy, B., M. Horwath, F. Blarel,F. Remy, JM. Lemoine, Temporal Change of the Antarctic and Greenland Ice Volume and Mass, Living Planet Symposium, Bergen, June 2010

