Eddies: two sides to the story
Image of the Month - November 1999
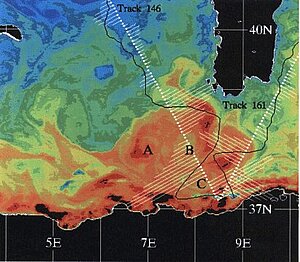
Algerian current eddy: sea surface temperature and altimetry, April 19, 1993. White lines show current velocity, derived from altimetry data, along the T/P satellite ground track; black lines show altimetric sea level measurements; colors indicate temperature (blue to red). (Credits Istituto di Fisica dell'Atmosfera CNR)
Satellite altimeters provide a very clear view of eddy structures, but other sensors are also capable of locating them. For example, sea surface temperature sensors "see" eddies as warm or cold spirals, whereas altimeters see the same structures as peaks and valleys. Depending on whether an eddy is a peak or valley, and depending on whether it is in the northern or southern hemisphere, we can determine its direction of rotation. Further, by looking at a peak's slope we can determine the velocity of the current inside the eddy, i.e., the steeper the slope the faster the current.
See also:
- Image of the month, January 2006 : <link en news image-of-the-month jan-2006-merging-of-altimetry-data-proofs-from-other-measurements index.html _self internal-link>Merging of altimetry data: proofs from other measurements
- Satellites Monitor The Mediterranean Pulse (pdf, 3.3 Mb).
Websites on this subject:
- For kids
- How do satellites measure the ocean (JPL physical oceanography for kids) - Sciences articles
- Interdisciplinary study of the algerian basin mesoscale instabilities
- A Combined use of ERS-1 and Topex/Poseidon data to study the mesoscale dynamics in the Mediterranean Sea

