El Niño bulletin
Latest plots
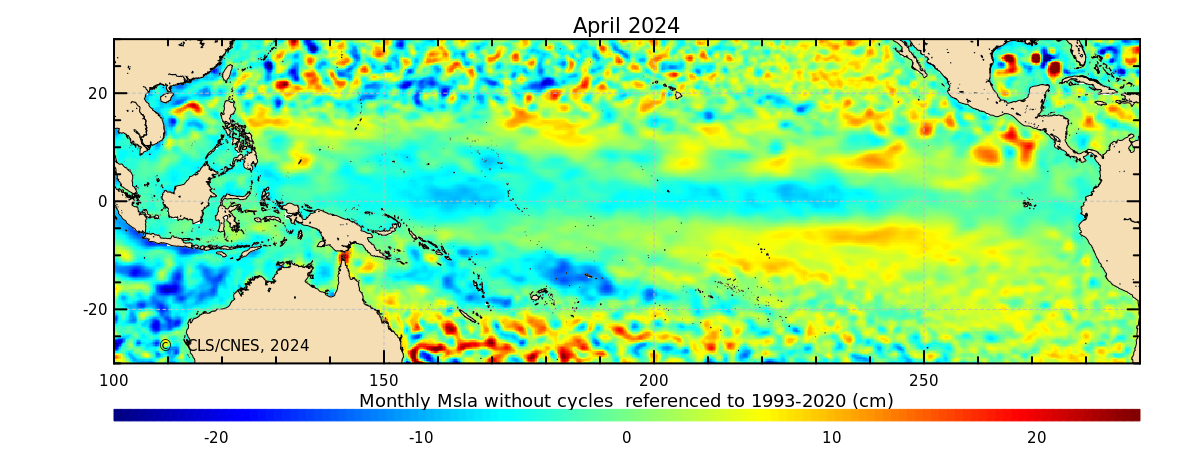
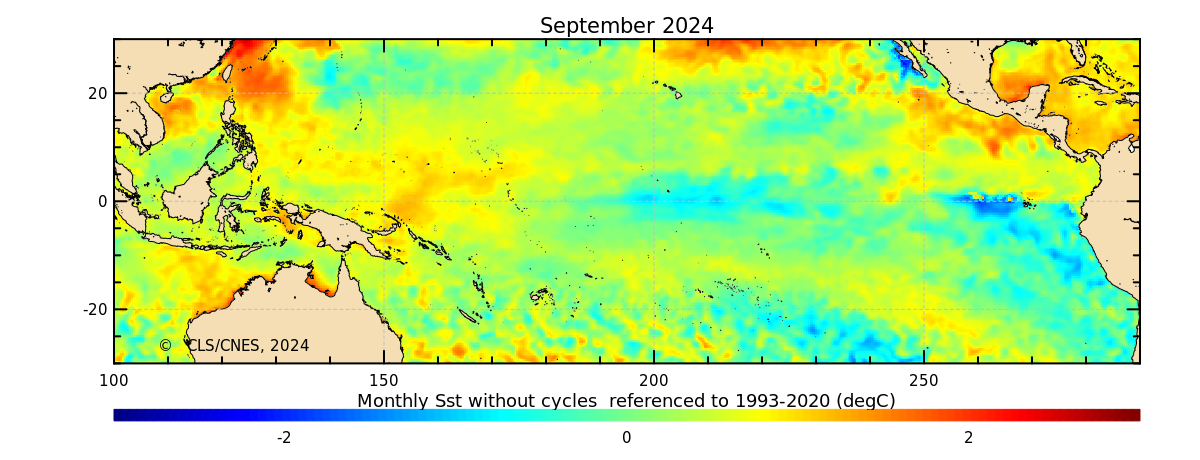
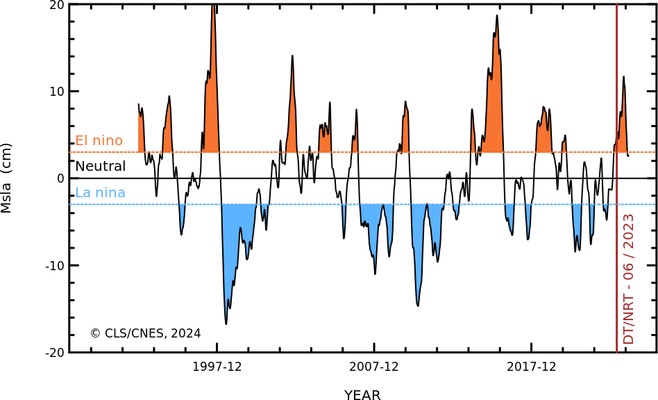
Latest monthly mean of Sea Level Anomalies over the Tropical Pacific (MSLA are computed from SSALTO/Duacs, annual and seasonal cycles removed,
see the product sheet). A map of the latest Sea Surface Temperature is also available.
See also previous maps for MSLA and Sea Surface Temperature. Credits CNES/CLS.
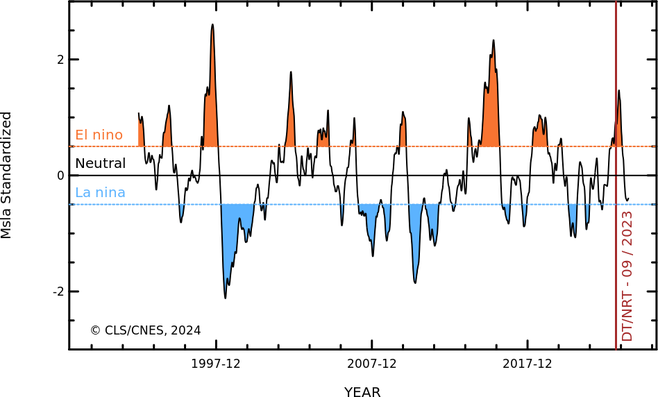
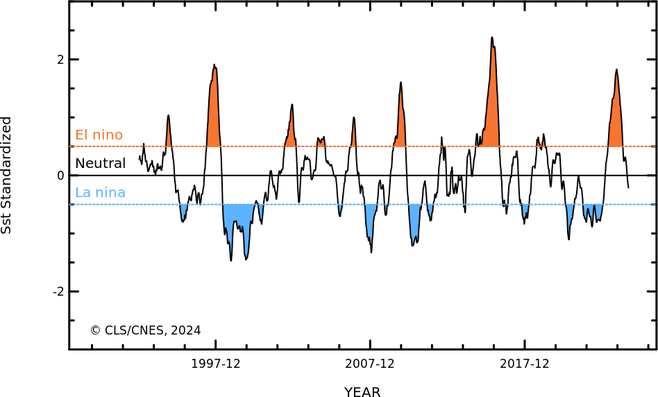
Standardized Sea Level Anomalies over the Nino3.4 region (MSLA are computed from SSALTO/Duacs maps, see product sheet). See also non-standardized Sea Level Anomalies. A standardized Sea Surface Temperature is also available. Credits CNES/CLS.
The ENSO index is based on the altimeter sea level anomalies over the Nino3.4 region in the Pacific ocean. The annual, seasonal cycles and 60-day signal have been filtered out and the sea level trend has been removed. Monthly time series are computed and normalized.
So note that since April 2022, a new version taking into account the mean sea level trend has been implemented as described here
MSLA are computed from Ssalto/Duacs. More information on MSLA products is given on the product sheet.
See also non-standardized Sea Level Anomalies
Sea Surface Temperature
The ENSO index is also derived from the sea surface temperature over the Nino3.4 region in the Pacific ocean. The annual, seasonal cycles and 60-day signal have been filtered out and monthlynormalized time series are computed.
A map of the latest Sea Surface Temperature (annual and seasonal cycles removed ) is also available. Click here to display There were no change in the Sea Surface Temperature computation in January 2020.
*A plot of the time evolution of the Standardized Sea Surface Temperature over the Nino3.4 region (annual and seasonal cycles removed) is also here.
VISUALIZATION AND DOWNLOAD
- Monthly maps for MSLA and for Dea Surface Temperature fom January 1993 can be seen on the AVISO Ocean Bulletin website
- Time series of MSLA and Sea Surface Temperature are available for download via :
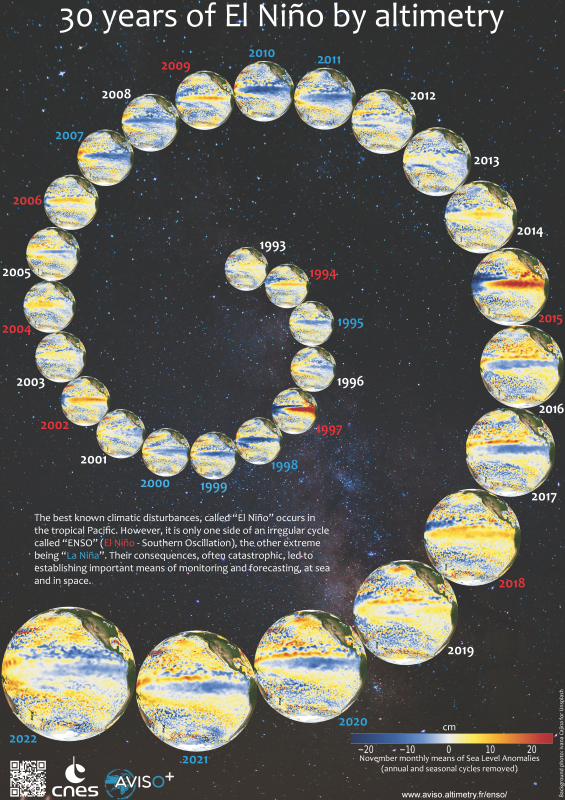
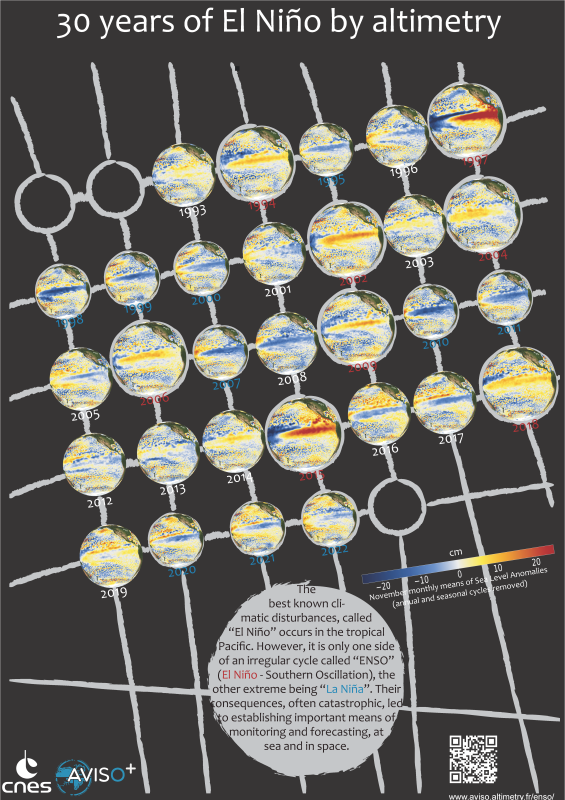
https://data.aviso.altimetry.fr/aviso-gateway/data/indicators/enso/ - Posters: Click on each image to download the posters
-
FOR MORE INFORMATION
- Applications: ENSO
- Other observations
- CPC/NCEP (every Monday, sea surface temperature maps, subsurface analysis - thermocline variations - temperature/depth diagrams...)
- Maps and sections from the TAO array
- Forecasts :

