April 2022: New update of the El Niño Southern Oscillation (ENSO) index
The altimeter sea level measurements are used to derive the ENSO index, which provides an estimate of the variations and intensity of this large scale phenomenon, strongly related to the ocean circulation and climate variations (see dedicated web page). In April 2022, the processing of the ENSO index has been updated to take into account a longer period to estimate the different cyclic signals and the trend, and uses the new version of the altimetry maps (DUACS DT2021, see https://catalogue.marine.copernicus.eu/documents/QUID/CMEMS-SL-QUID-008-032-068.pdf).
The ENSO index is computed from preprocessed altimeter sea level maps, which are corrected for the annual, seasonal and 60 days signals. In April 2022, the altimeter sea level maps are also corrected for the trend in each grid point. The reference period used to estimate the periodic signals has been upgraded and changed from 1993-2016 to 1993-2020.
The changes are summarized in the table below:
| 2020 version | April 2022 version | ||
|---|---|---|---|
| Estimations of | Annual signal | DT-2018 | DT-2021 |
| Seasonal signal | |||
| 60-day signal | |||
| Trend | removed | Removed |
Impact on the ENSO index:
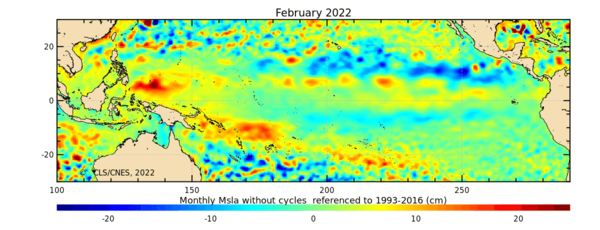
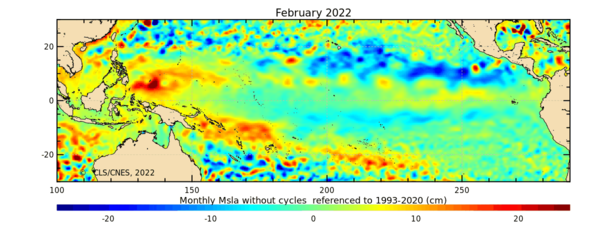
The figure below illustrates the impact of these changes on the monthly map of sea level anomalies for February 2022. Between the 2020 version (top) and the April 2022 version (bottom), slight differences arise due to the longer reference period and from the reprocessed altimetric maps.
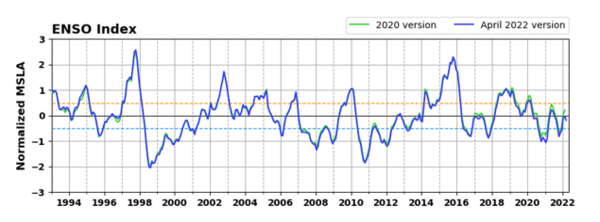
The figure below shows the impact on the ENSO index timeseries. The green curve represents the 2020 version and the blue curve the April 2022 version. The differences are very small and do not modify the El Niño (above the dashed orange dashed line) and the La Niña (below the dashed light blue line) temporal periods.