A buoy trapped in filaments
Image of the Month - September 2018
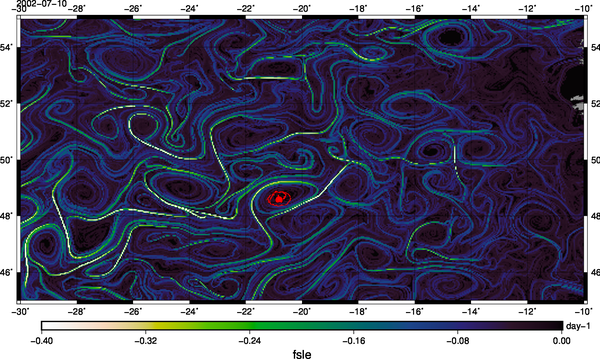
A drifting buoy track overlaid on Lyapunov exponents from altimetry. All the time the buoy was in an area of exponents close to 0 (in day-1), it staid there; when "touching" a more negative filament, it left the area quite fast. See the animation (buoy location by Argos for Météo France, FLSE Cnes/CLS/LOcean/CTOH/Legos; map by Aviso)
Lyapunov exponents (aka FSLE, aka filaments) are a dataset which can seem rather hard to interpret. However, sometimes, complementary data explain things better than any text or formulas. Some years ago, a scientist at Météo France was intrigued by the fact some of his buoys were going round and round (which in fact suited him, since those buoys were thus taking atmospheric measurements at the same place for a time). Comparing the buoys' Argos tracks with altimetry, we saw correlation with altimetry-observed eddies (see Ocean mesoscale multisensor applications: Altimetry and buoys, bottom case). Now, buoys circling in the same area, and after a time going away can also be interpreted with the point of view of convergences or divergences -- which is what Lyapunov exponents are showing.
Refining data, computing new datasets showing new angles to the physics of the ocean is among the work done during these past 26 years with the continuous series of altimetry data. The series are ongoing, and scientists and engineers are looking always to new ways of exploiting them, in all their dimensions (time included). SWOT will bring a new dimension, and much higher resolution to this -- new ideas are developping even now on how to take the most of all this.
See also:
- Image of the Month, July 2016: Elephant seals and macaroni penguins follow threads
- Image of the Month, September 2009:Birds track ocean eddies
- Image of the Month, October 2008: Thread-like structures extracted from altimetry
- Applications: oceanography / multi-sensors
- Applications: Oceanography / submesoscale circulation
- Data: FSLE in delayed-time or 20-days delay
- Missions: Swot

