Mean Sea Level in New-Caledonia seen by tide gauges, altimetry and Doris
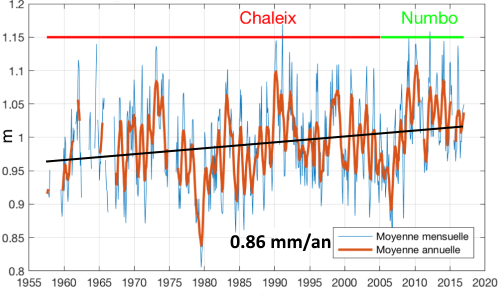
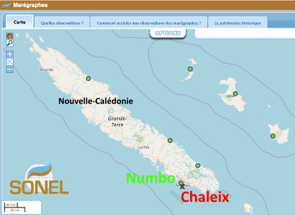
In a study published this summer in the journal Pure and Applied Geophysics [1], researchers from IRD, SHOM and the University of Hawaii digitised tide gauge data records from 1957 to 1967 at Cape Chaleix, near Noumea, which existed only on paper. Then, these data were combined with those of another series of data recorded at Chaleix as well as with those from another nearby tide gauge, at Numbo Bay. This set represents a nearly 60-year-long series of coastal sea levels.
This time serie shows irregular evolutions of the sea level over different periods. If, between 1957 and 2016, the sea level is rised locally at an average speed of +0.86 mm / year (figure below), between 2005 and 2015, for example, it rose by +10.3 mm / year. These interannual variations are due to climatic phenomena at a large-scale like El-Niño. Only this 60-year-old dataset can be used to compute a relevant and realistic trend in rising sea levels; critical to study the regional and interannual variations of the sea level, to follow and predict this tendency to their elevation, as a direct consequence of global warming.
This tide gauge data has been combined with more than 20 years of satellite altimetry data to evaluate the vertical movements of the earth's crust. This 20-year indirect analysis method shows an uplift movement of the earth's crust at the tide gauge of 1.3 to 1.4 mm / year, opposite to the more recent direct GNSS measurements at nearby sites, which indicate a subsidence movement of the same order of magnitude. These differences between direct measurements and analysis further emphasizes the importance of systematic geodetic measurements at, over very near tide gauges.
Doris station positions
In parallel to this study, we can also illustrate the vertical movements of the earth's crust from the precise positions and average speeds Doris ground stations. Such a Doris station exists in Noumea, not far from Chaleix Point. The adjacent animation shows how to access to these time series on the IDS website and how to access the value of the slope of the Doris station over a defined period. Thus over the 2005-2017 period, the measured slope shows a subsidence movement of the order of 1.3 mm / year. |
|
Animation how-to plot time series for the positions of Doris ground stations. |
Further d'information:
- Image of the month, Feb. 2016 : Thule Doris station's rising at different velocities
- Doris, precise orbit determination and positioning system
- IDS website
Data access
- from Aviso website:
- Indicator Mean Sea Level, MSL
- Altimetry data Sea Surface Heights : gridded and along track
- from ODATIS catalogue:
- tide gauge data
- from IDS website, user interface to plot time series for the positions of Doris ground stations
References
- [1] Aucan J., M. A. Merrifield and N. Pouvreau (2017) : Historical sea level in the South Pacific from rescued archives, geodetic measurements and satellite altimetry, Pure And applied Geophysics, doi: 10.1007/s00024-017-1648-1


