Hurricane Dorian seen by satellites
Hurricane Dorian is the first major hurricane of the 2019 Atlantic hurricane season. It started on August 24 in the Central Atlantic and was classified as hurricane on August 28. It intensified rapidely in Category 4 major hurricane on August 31 and in Category 5 on September 1st while reaching the Bahamas. Its powered winds were one-minute sustained at 295 km/h with a minimum central pressure of 910 millibars. Dorian made a second landfall several hours later in the same region with almost the same intensity. This highlights the exceptional dimensions of this cyclone. On September 3, Dorian weakened to Category 2 and moved towards the north-northwest and regained Category 3 over warmer waters on September 5. It made rainfall in the U.S. on September 6 as it was in Category 1. Dorian devastated the Bahamas and the U.S. declared a state of emergency on the coast.
Fig 1: CFOSAT wave parameters (height, direction, wavelength) for tracks 94 (08/30), 139 (09/01), 169 (09/01) and 216 (09/03) when the cyclone moves westwards superimposed on the ECMWF wave height model, with the NOAA positions of Dorian. Click to enlarge. Credits CNES/CLS.
Several examples given below illustrate measurements of wave parameters (height, direction,...), wind speed or energy content from CFOSAT (CNES/CNSA), Copernicus Sentinel-3 (ESA/EUMETSAT), Jason-3 and Jason-2 (CNES/NASA/EUMETSAT/NOAA), Cryosat-2 (ESA), SARAL/AltiKa (ISRO/CNES), Copernicus Sentinel-1 (ESA), Soil Moisture and Ocean Salinity (SMOS, ESA) and Soil Moisture Active Passive (SMAP, NASA) satellites, and also PSY4-QV3 (Mercator Ocean/CMEMS) models.
Wave heights measured by CFOSAT
The Chinese (CNSA) and French (Cnes) Space Agencies jointly launched the Chinese-French Oceanic Satellite (CFOSAT) mission on October 29 2018 (see our dedicated news), devoted to the monitoring of the ocean surface wind and wave, and related ocean and atmospheric science and applications. This pre-operational mission carries two main instruments onboard: the french radar SWIM (Surface Wave Investigation and Monitoring) to determine the direction, height and wavelength of surface waves and the chinese scatterometer SCAT to measure wind speed. The objective of this mission is to supply wind/waves observations on one hand to the meteorological agencies in order to improve their forecast and sea state models and on the other hand to the scientific community for the oceanographic and climate research in order to improve the sea models as well as the understanding of the influence of sea state in surface fluxes.
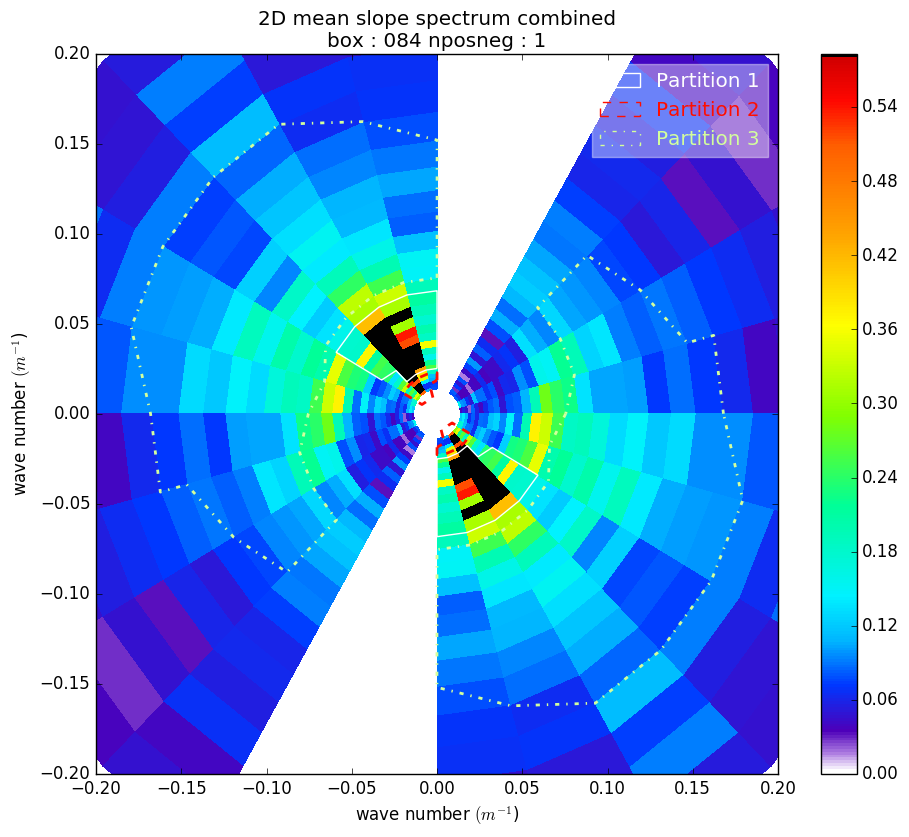
The SWIM measurements are processed by the french ground segment and some acquisitions were made crossing Dorian’s path. The satellite provides nadir along-track measurements which can be used as the classic altimetry missions, but it also provides the wave spectrum in two dimensions, the wave direction, wavelength and SWH per sea state through multi-azimuth multi-incidence observations (0°,2°,4°,6°,8°,10°). Those parameters are estimated as follows: the mean wave slope directional spectra are done on geographic boxes of 70x90 km on either side of the track. A partitionning algorithm is used to detect up to 3 partitions in the spectrum domain, and wave spectral parameters (direction, wavelength and height) are calculated on the full and partitionned spectrum. Those parameters can be represented by arrows. On figure 2 the showed spectrum has been calculated on one box along the track on September 3, and the wave parameters are plotted between August 30 and September 3 (fig 1).
Significant Wave Heights measured along-track by Jason-2, Jason-3, Copernicus Sentinel-3A and Sentinel-3B, Cryosat-2, SARAL/Altika and CFOSAT
The altimeter missions crossed the Dorian's path between August 29 to September 4. Figure 4 shows the Significant Wave Height of Jason-2, Jason-3 and SARAL/AltiKa from IGDR products, of Copernicus Sentinel-3A and Sentinel-3B Level-2 Plus (L2P) products (these products are distributed by Aviso+), Cryosat-2 NOP distributed by ESA and CFOSAT L2 products which will be soon distributed by Aviso+.
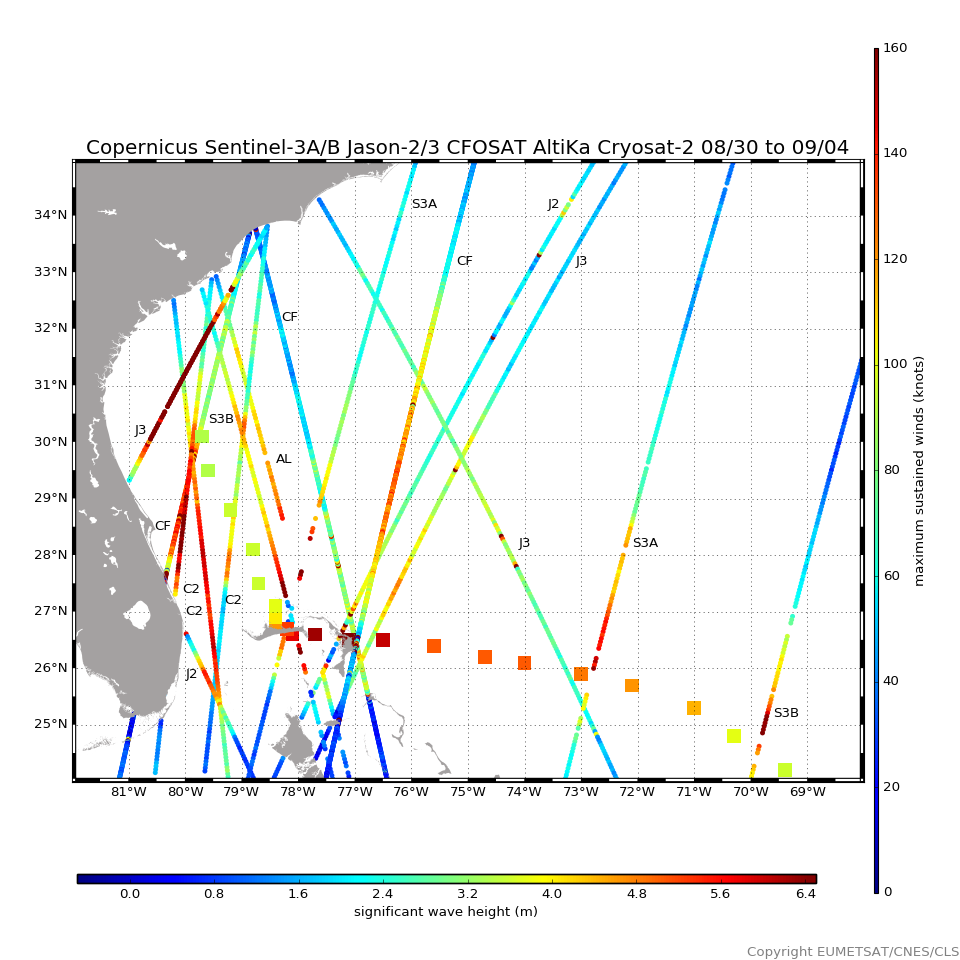
Fig 3: Altimeter Significant Wave Heights (in m) crossing the Dorian's path between August 29 and September 4 2019.,
for the missions CFOSAT, Jason-2/3, Copernicus Sentinel-3A/B, SARAL/AltiKa and Cryosat-2.
The hurricane positions and the maximum sustained winds (in knots) from NOAA are plotted.
Click below to animate ![]()
Credits EUMETSAT/CNES/CLS.
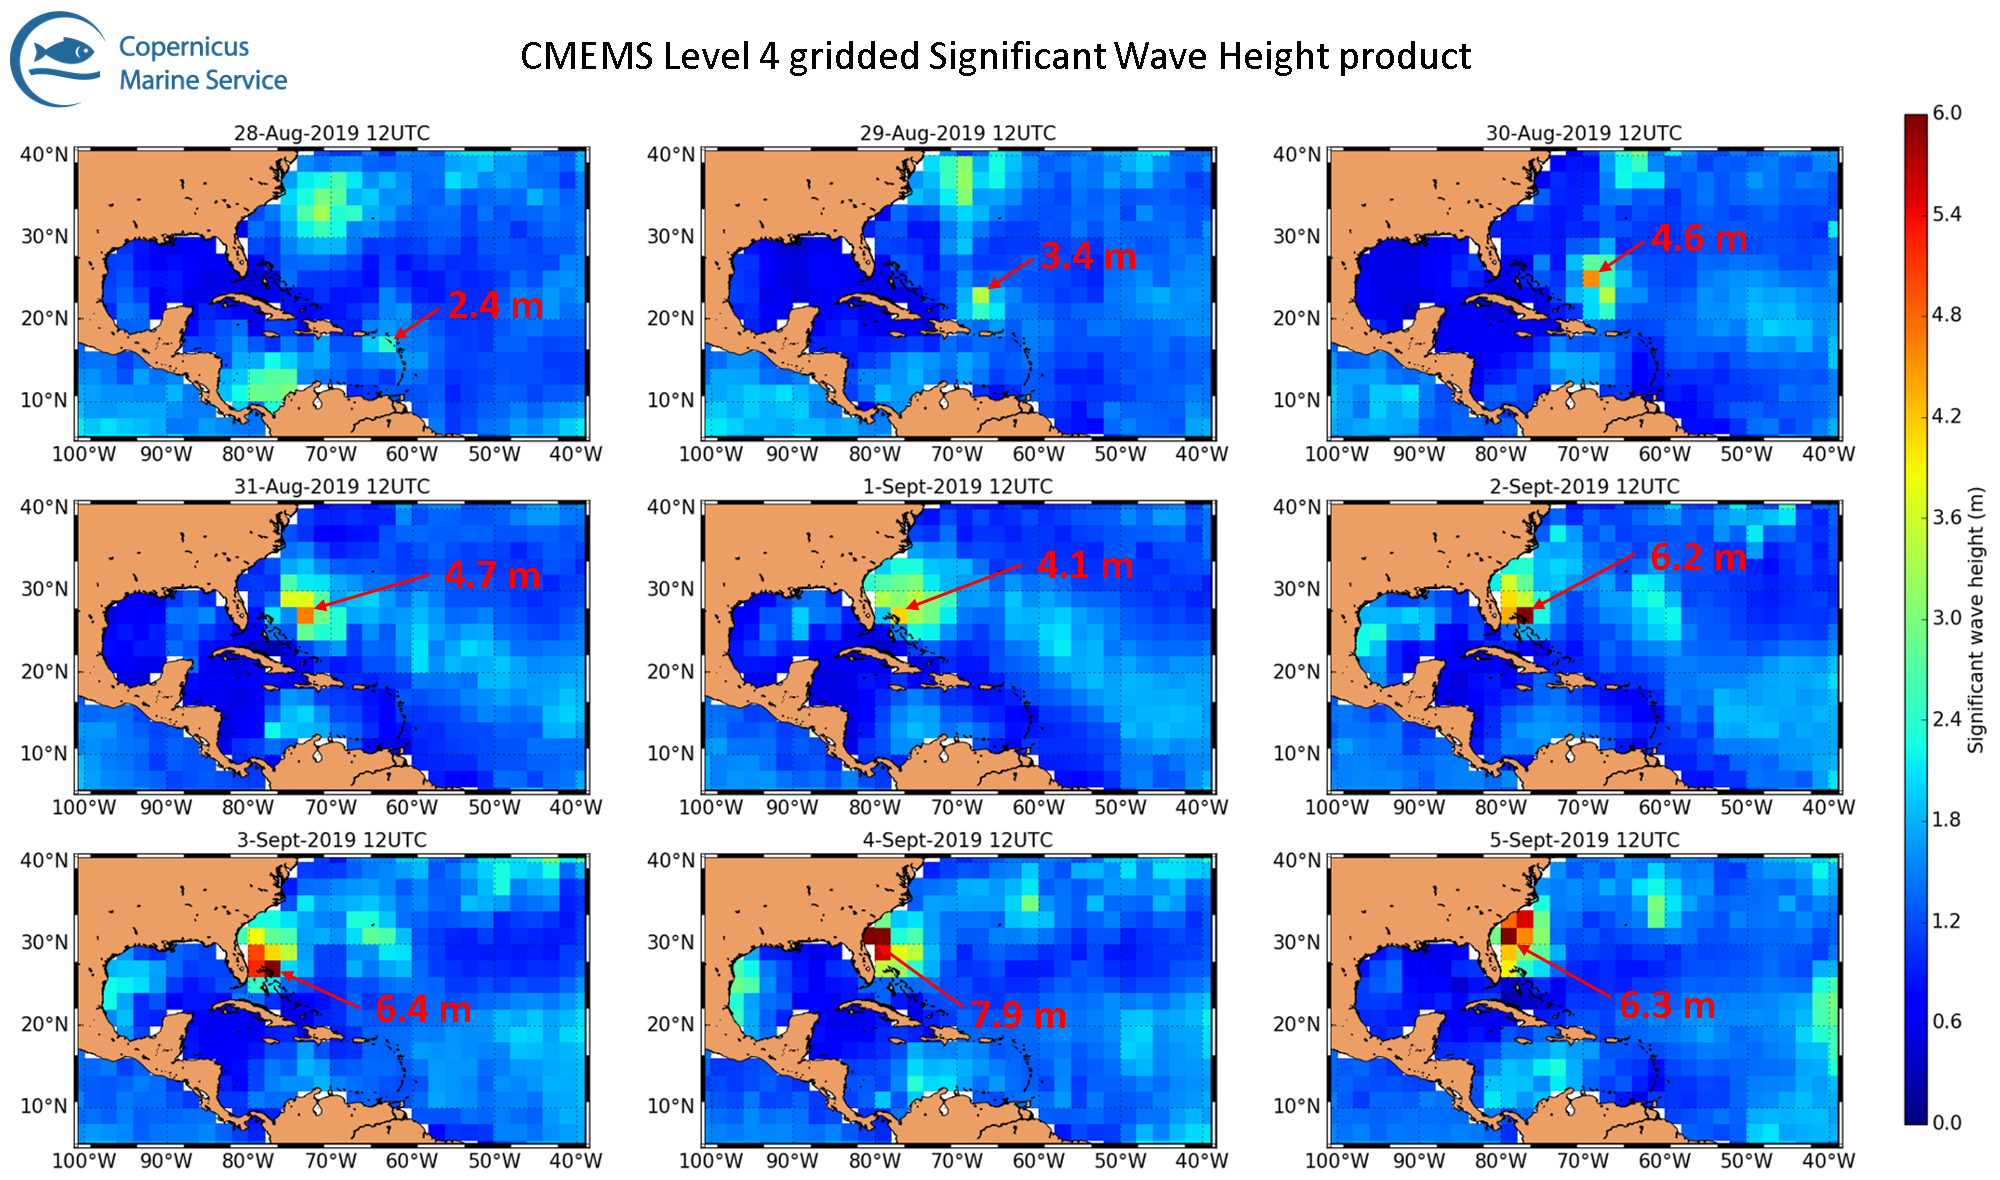
Maps of instantaneous Significant Wave Height are produced within the Copernicus Marine Environment Monitoring Service. This Level 4 gridded wave product merges along-track (level 3) measurements from 5 altimeters (Jason-3, Sentinel-3A and 3B, Cryosat-2 and SARAL/AltiKa) to deliver an estimate of the wave height field in Near-Real-Time.
This figure shows the daily evolution of the wave field (product named WAVE_GLO_WAV_L4_SWH_NRT_OBSERVATIONS_014_003) as the Hurricane Dorian hits northwestern Bahamas and drifts West towards Florida. The daily evolution highlights the development and propagation of extreme wave heights, following the intensification of the hurricane.
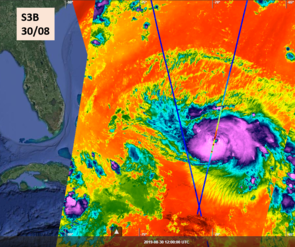
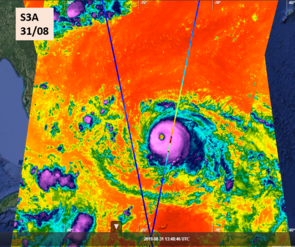
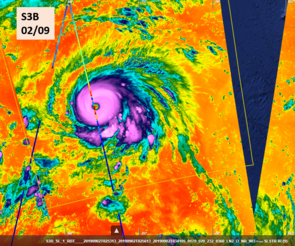
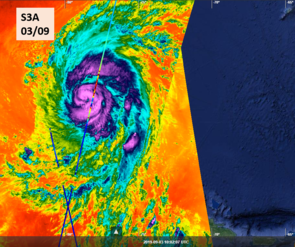
The figures below (Fig 5) show the along-track Copernicus Sentinel-3A and Sentinel-3B Wave Height measurements from the altimeters (without any editing) superimposed on the temperature seen by the SLSTR IR instruments. Those figures are obtained with the Sentinel-3 data viewer proposed by ESA (https://sentinel.esa.int/web/sentinel/missions/sentinel-3) in collaboration with OceanDataLab.
SAR wind speed measurements
Several SAR acquisitions were acquired with the Copernicus/ESA Sentinel-1 and the RadarSat-2 missions during Dorian’s lifetime.
The images of the on-board Synthetic Aperture Radar (SAR) contain alternating dark and light areas (see left plots below). The dark ones highlight areas of low backscattering values (low values in decibels) and are evidence of "quiet" areas, such as the eye of the cyclone. On the contrary, light areas with high backscattering values show rough surfaces (waves or rain). The high-resolution map of the surface wind field is derived from the backscatter measurements by combining both the vertical and horizontal polarizations (VV and VH) of the SAR instrument (see right plots below with the dedicated paper Mouche et al, 2019).
Thanks to the ESA initiative toward the spaceborne monitoring of Tropical Cyclones, the Satellite Hurricane Observation Campaign (SHOC) consists in a joint effort between the Sentinel-1 mission planning team, IFREMER and CLS. Once an alert is raised, the acquisition plan of both Sentinel-1 A and B missions is modified on short notice to capture the cyclonic event over the oceans before landfall including open ocean and coastal areas.
The access to RadarSat-2 data was supported by public funds (Ministère de l'Education Nationale, de l'Enseignement Supérieur et de la Recherche, FEDER, Région Bretagne, Conseil Général du Finistère, Brest Métropole) and by Institut Mines Télécom, received in the framework of the VIGISAT project managed by "Groupement Bretagne Télédétection" (GIS BreTel – Brittany Remote Sensing).
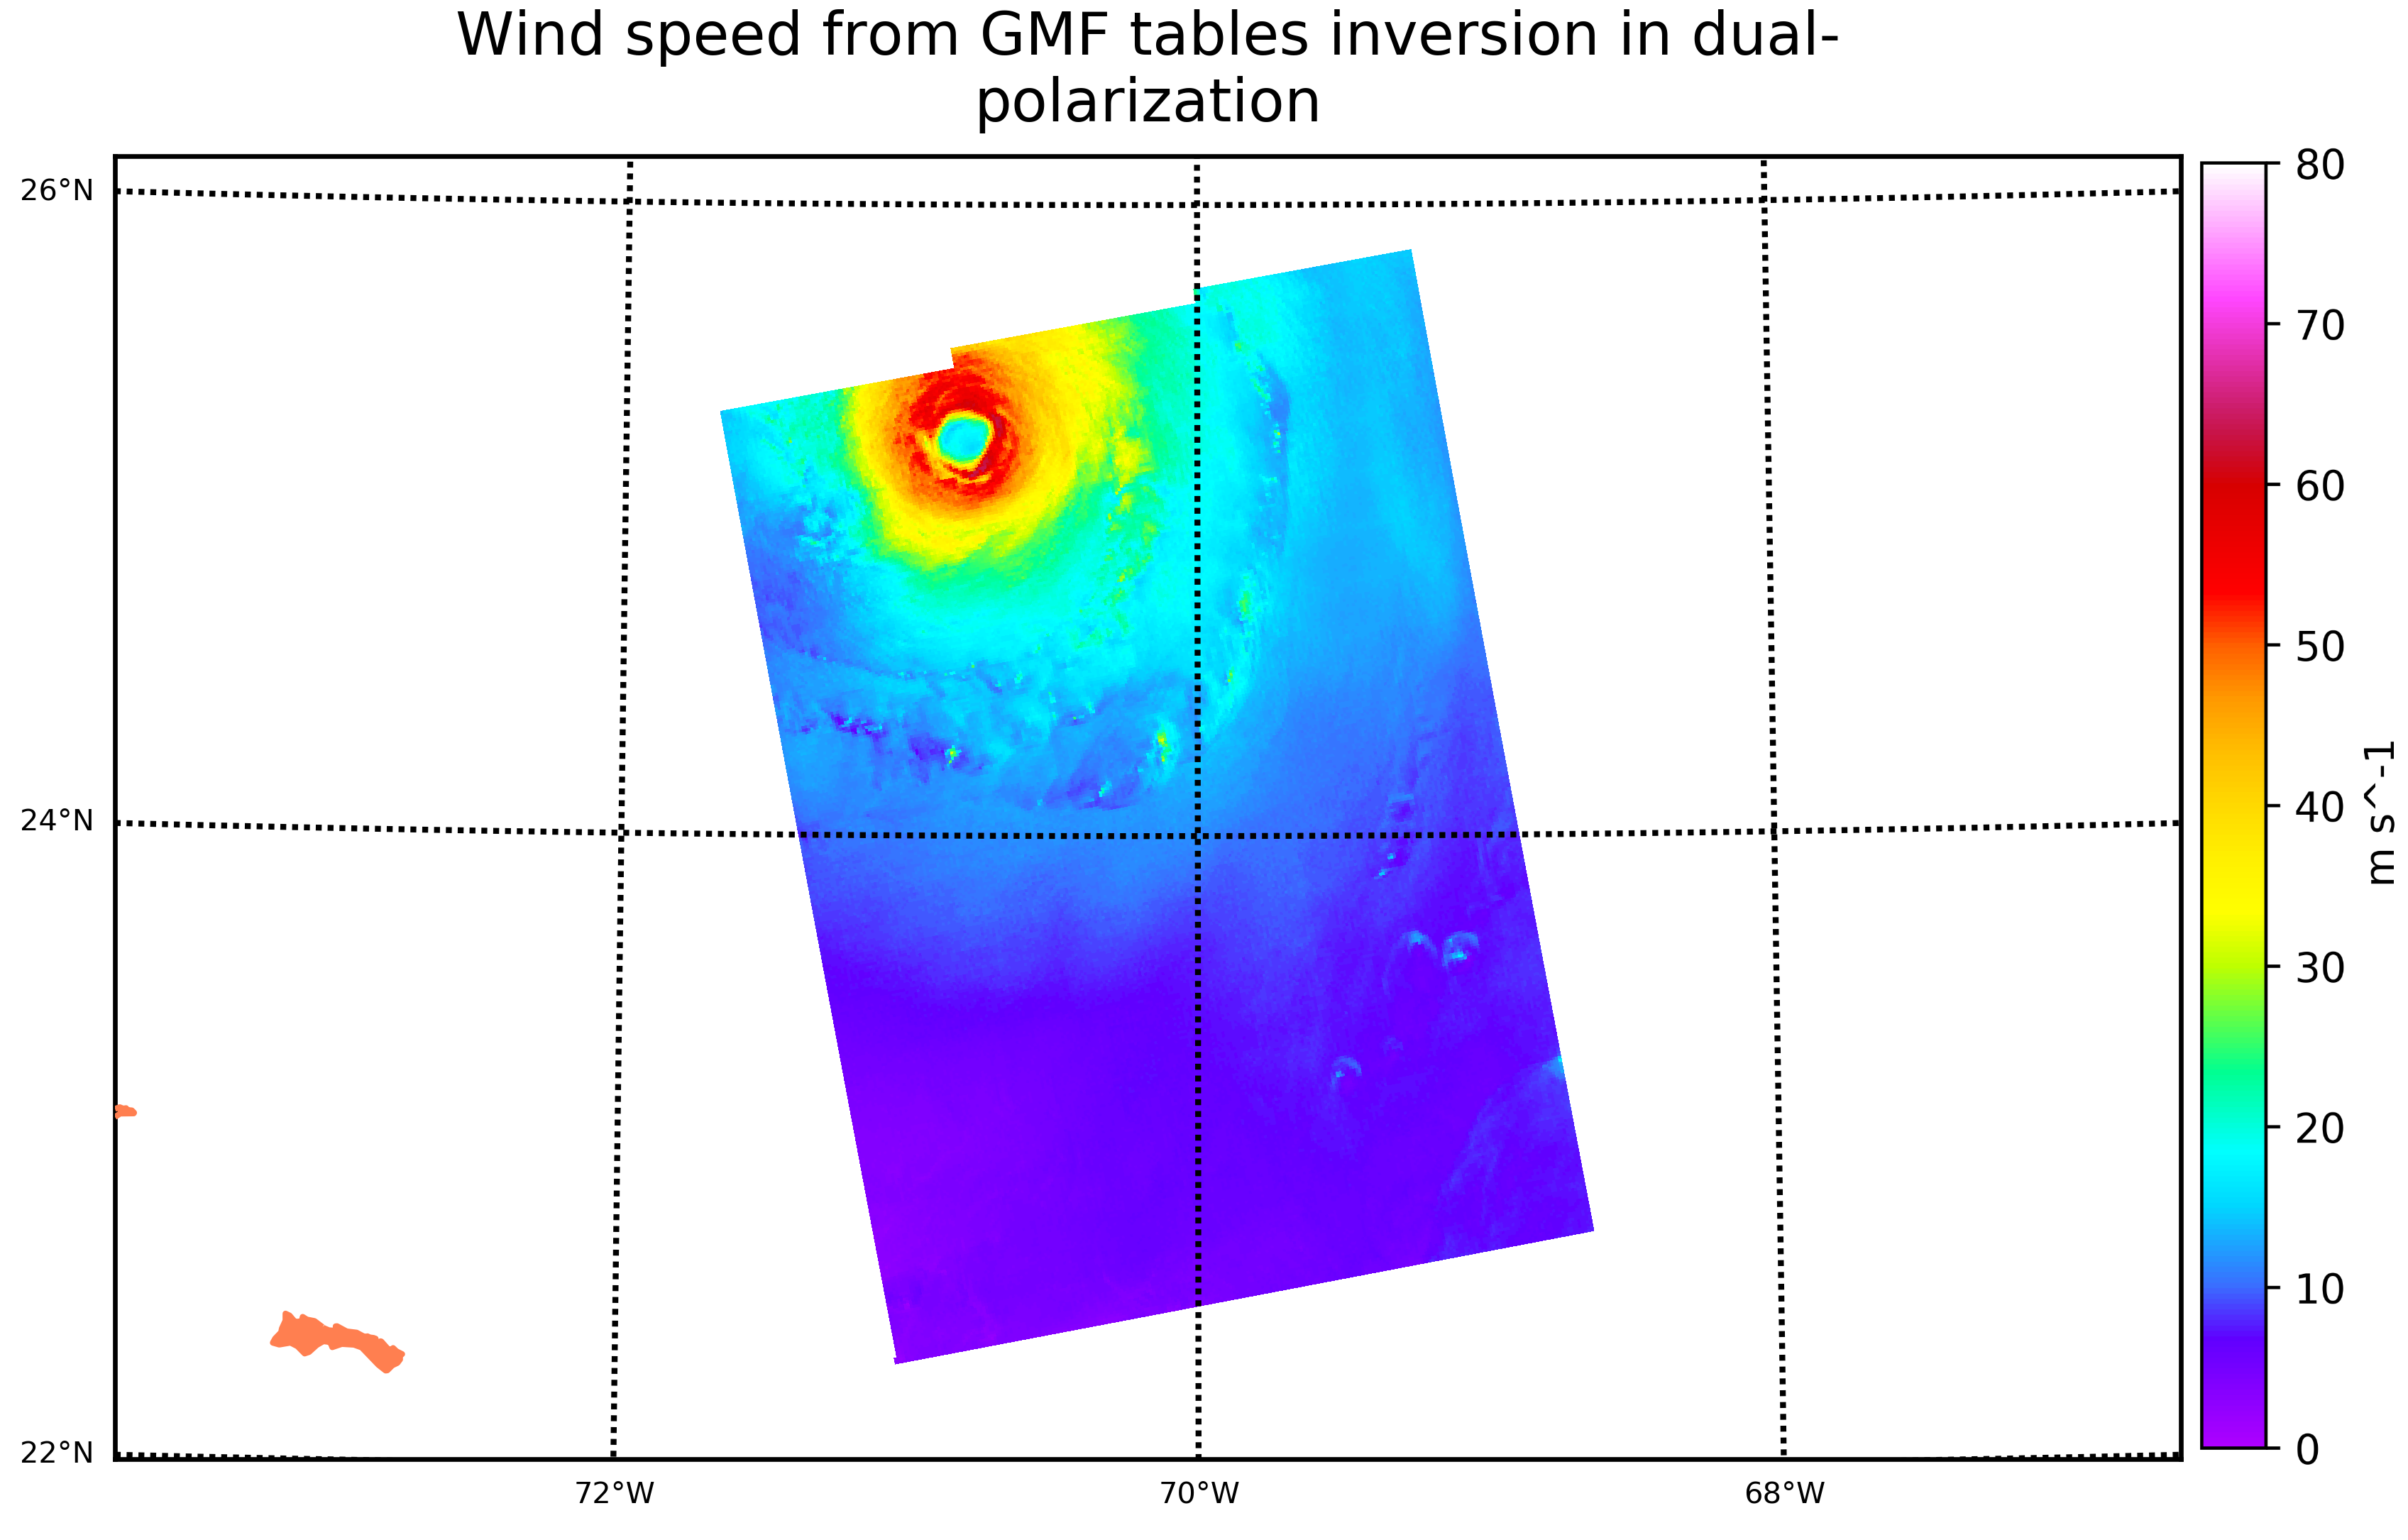
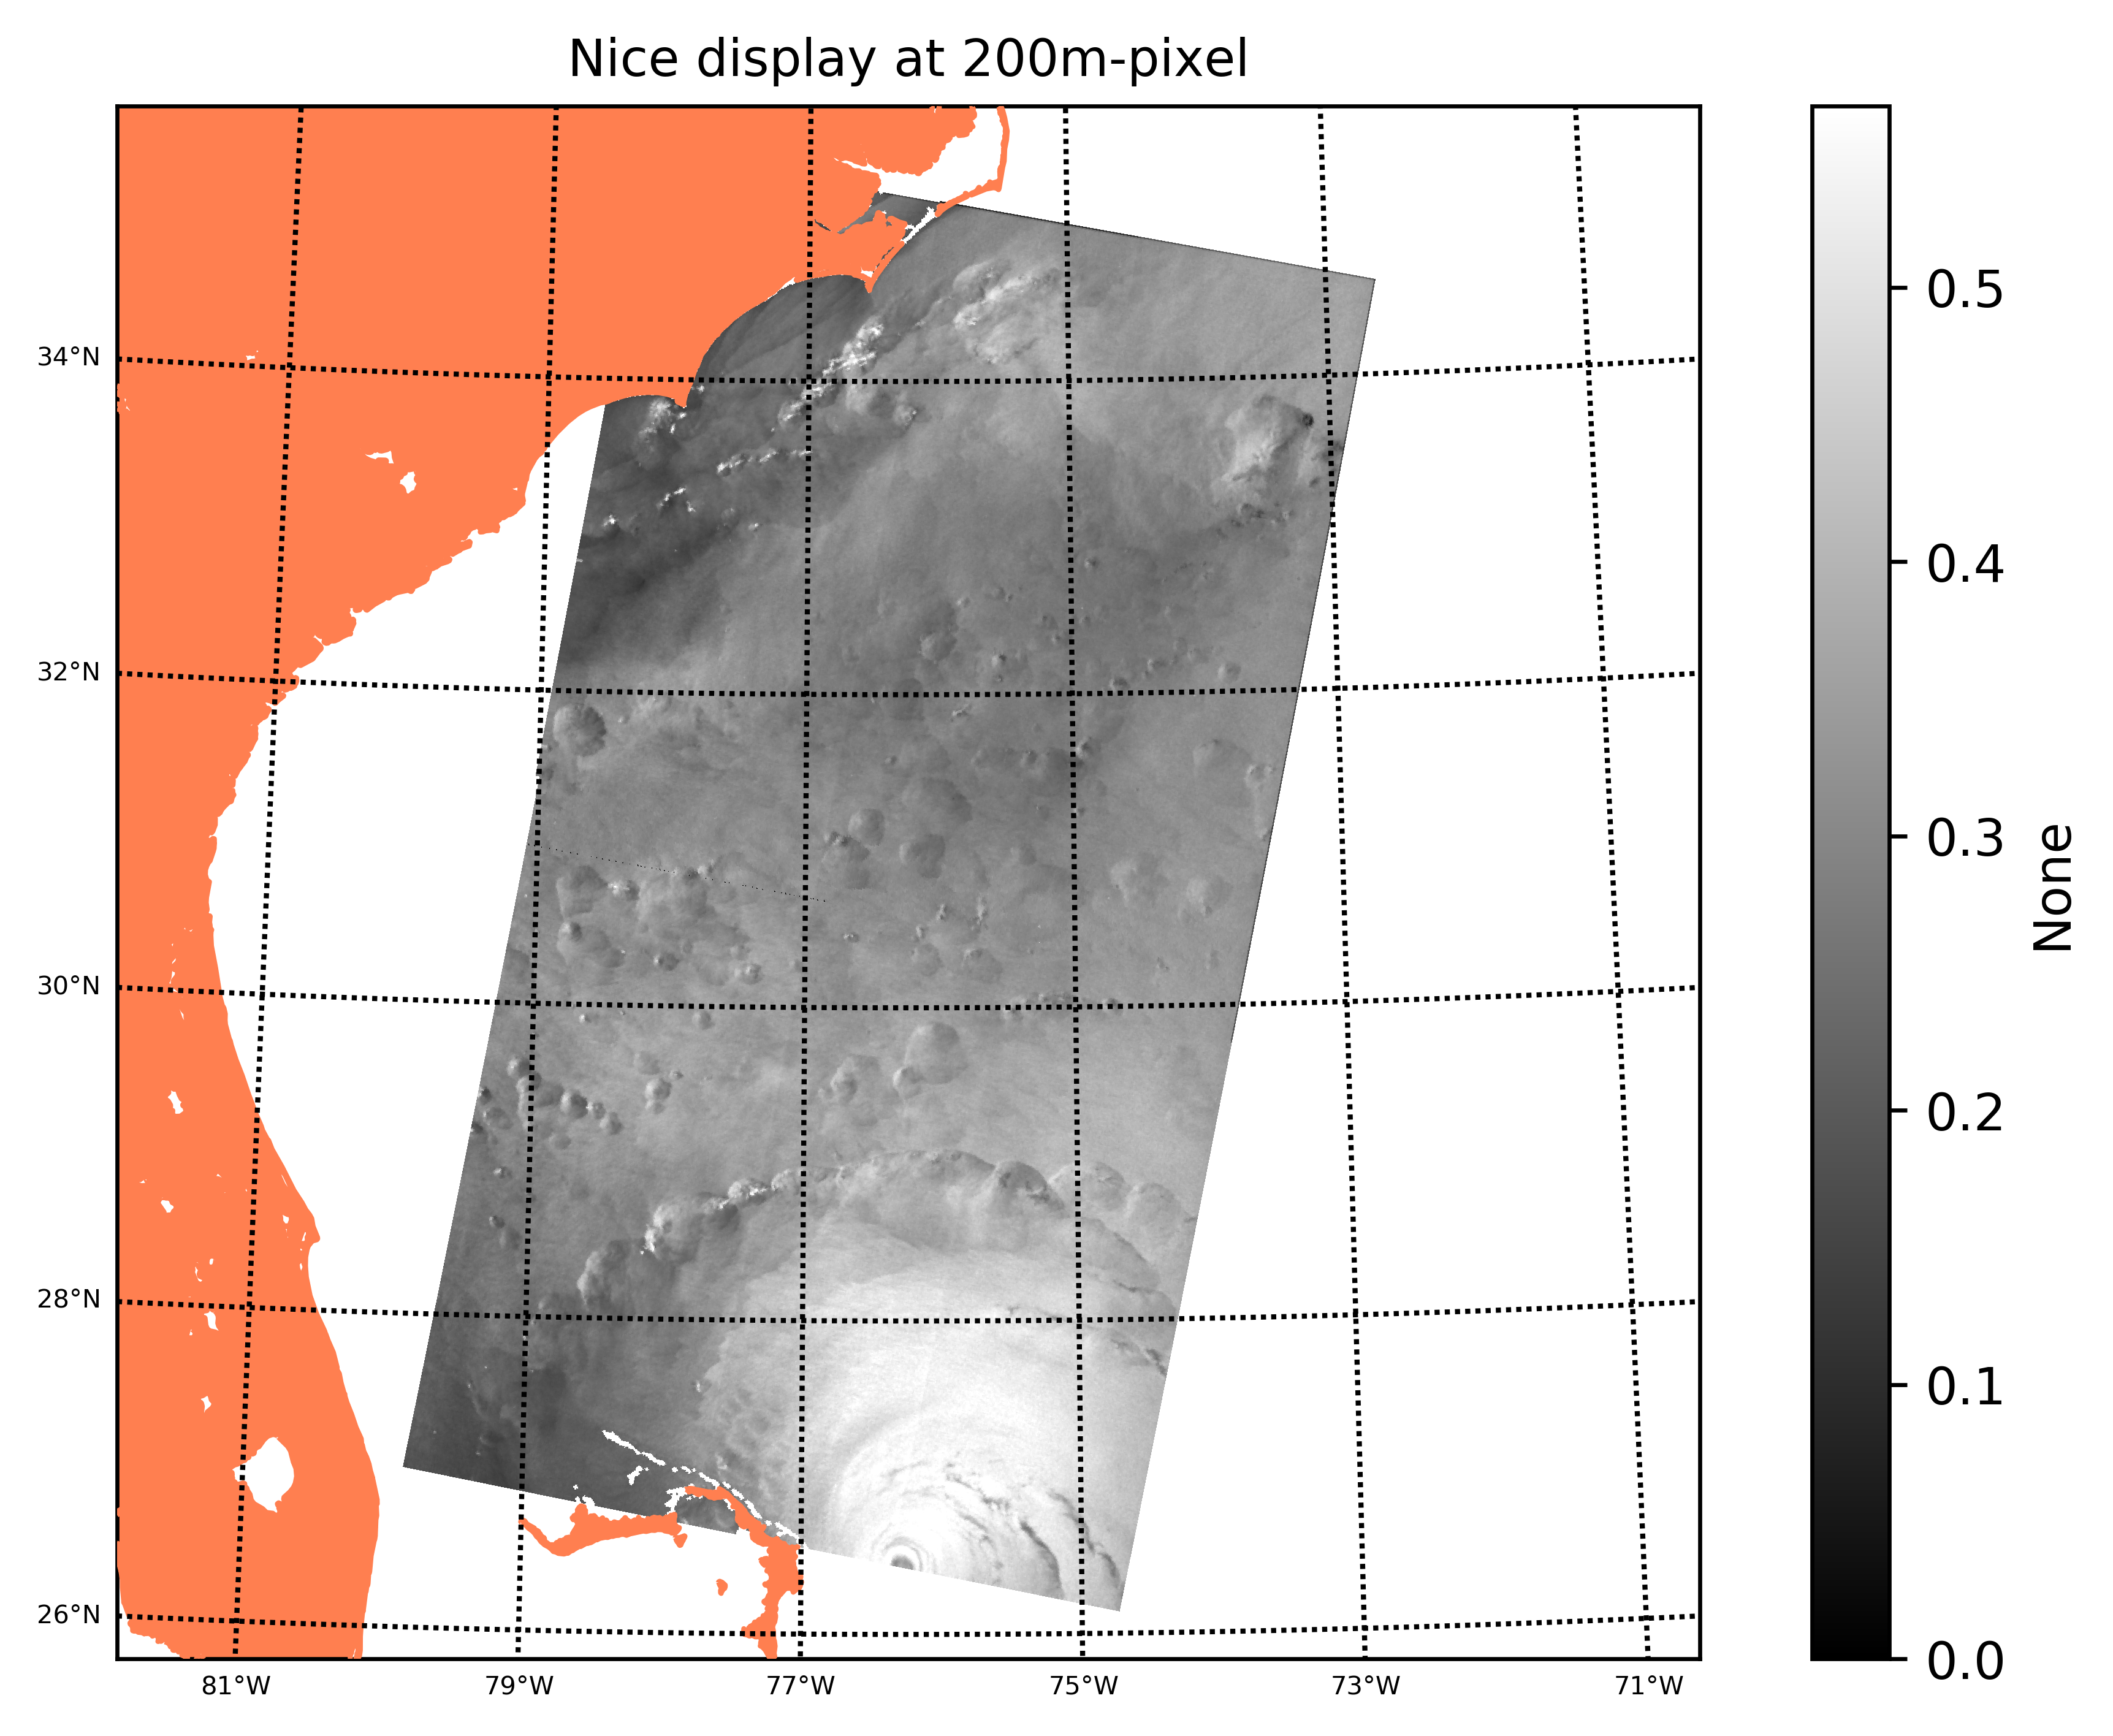
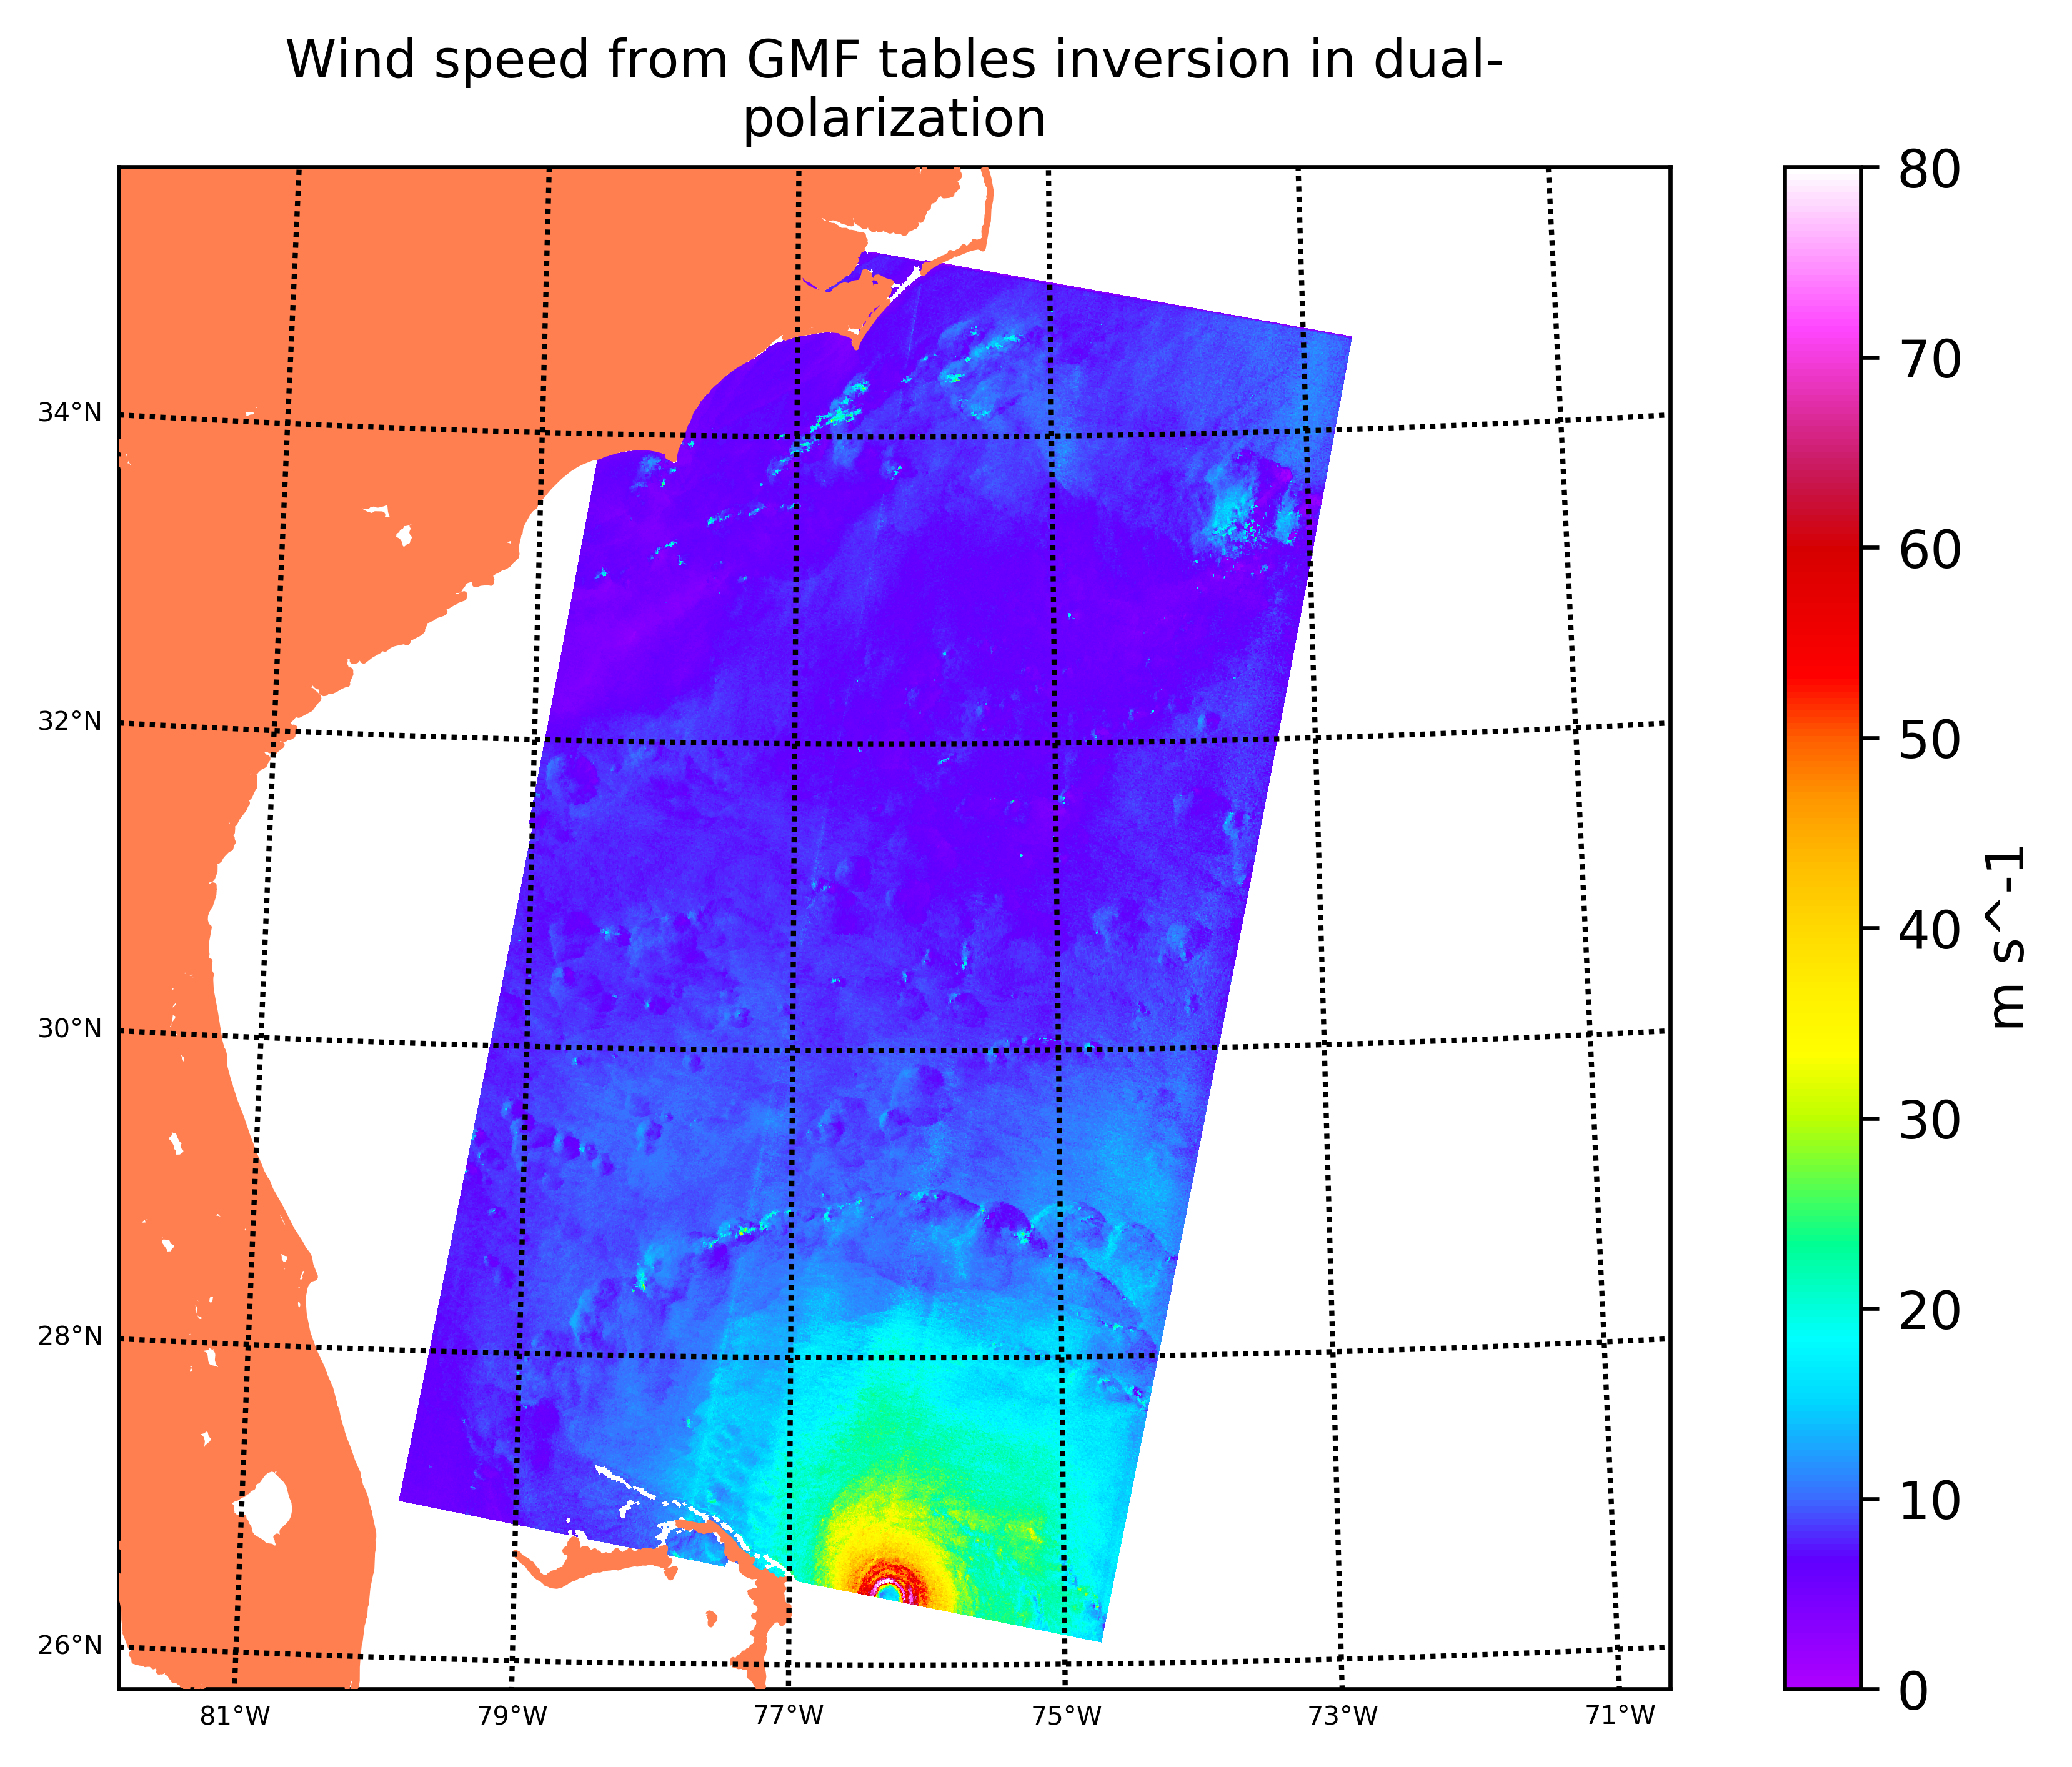
Fig 6: (left) SAR images and (right) high-resolution maps of derived surface wind field from
(top) Modified Copernicus Sentinel-1 data (2019) on August 30
(bottom) RADARSAT-2 data on September 1st from Maxar, routinely used by the SHOC team.
The algorithm used is described in Mouche et al., 2019
SMOS and SMAP wind speed retrieval
The European Space Agency Soil Moisture and Ocean Salinity (SMOS) and NASA Soil Moisture Active Passive (SMAP) missions provide L-band (electromagnetic frequency of 1.4 GHz) brightness temperature images of the Earth. Because upwelling radiation at 1.4 GHz is significantly less affected by rain and atmospheric effects than at higher microwave frequencies, the SMOS measurements offer unique opportunities to complement existing ocean satellite high wind observations in tropical cyclones and severe weather (Reul et al., 2012;Reul et al., 2016; Meissner et al., 2017) that are often erroneous in such conditions. The physical basis for surface wind speed retrievals in extreme weather from passive microwave radiometers involves emission from a rough, foam-covered sea surface. The sea state within tropical cyclones is complex and varies according to the storm sectors, but in the region where the wind speeds exceed tropical storm force (>17 m/s ~34 knots), breaking waves generate extensive foam patches and deep bubble layers. Foam patches are associated with high emissivity at microwave frequencies. The foam horizontal coverage and thickness extension as wind speed increases towards hurricane force and the associated emissivity increase are the basic principles for wind retrievals from radiometers. This information can be used as a means of remotely measuring surface wind speeds in hurricanes. Several intercepts of hurricane Dorian are available from both sensors on the 3, 4 and 6 September as it propagates along the east coast of US.
Wind speeds are processed and distributed to operational centers in NRT (within 4h from aquisition) for both sensors by ESA and Ifremer for SMOS (www.smosstorm.org) and by REMSS for SMAP (https://podaac.jpl.nasa.gov/SMAP, www.remss.com ). While these sensors are limited to provide the structure of the high-gradient regions, such as the eye and eyewall of hurricanes, because of their spatial resolution of 40 km, they do provide reliable and key estimates of the gale-force (34 kt), damaging (50 kt), and destructive winds (64 kt) radii (Reul et al., 2017) to help TC warnings, forecasts and operation.

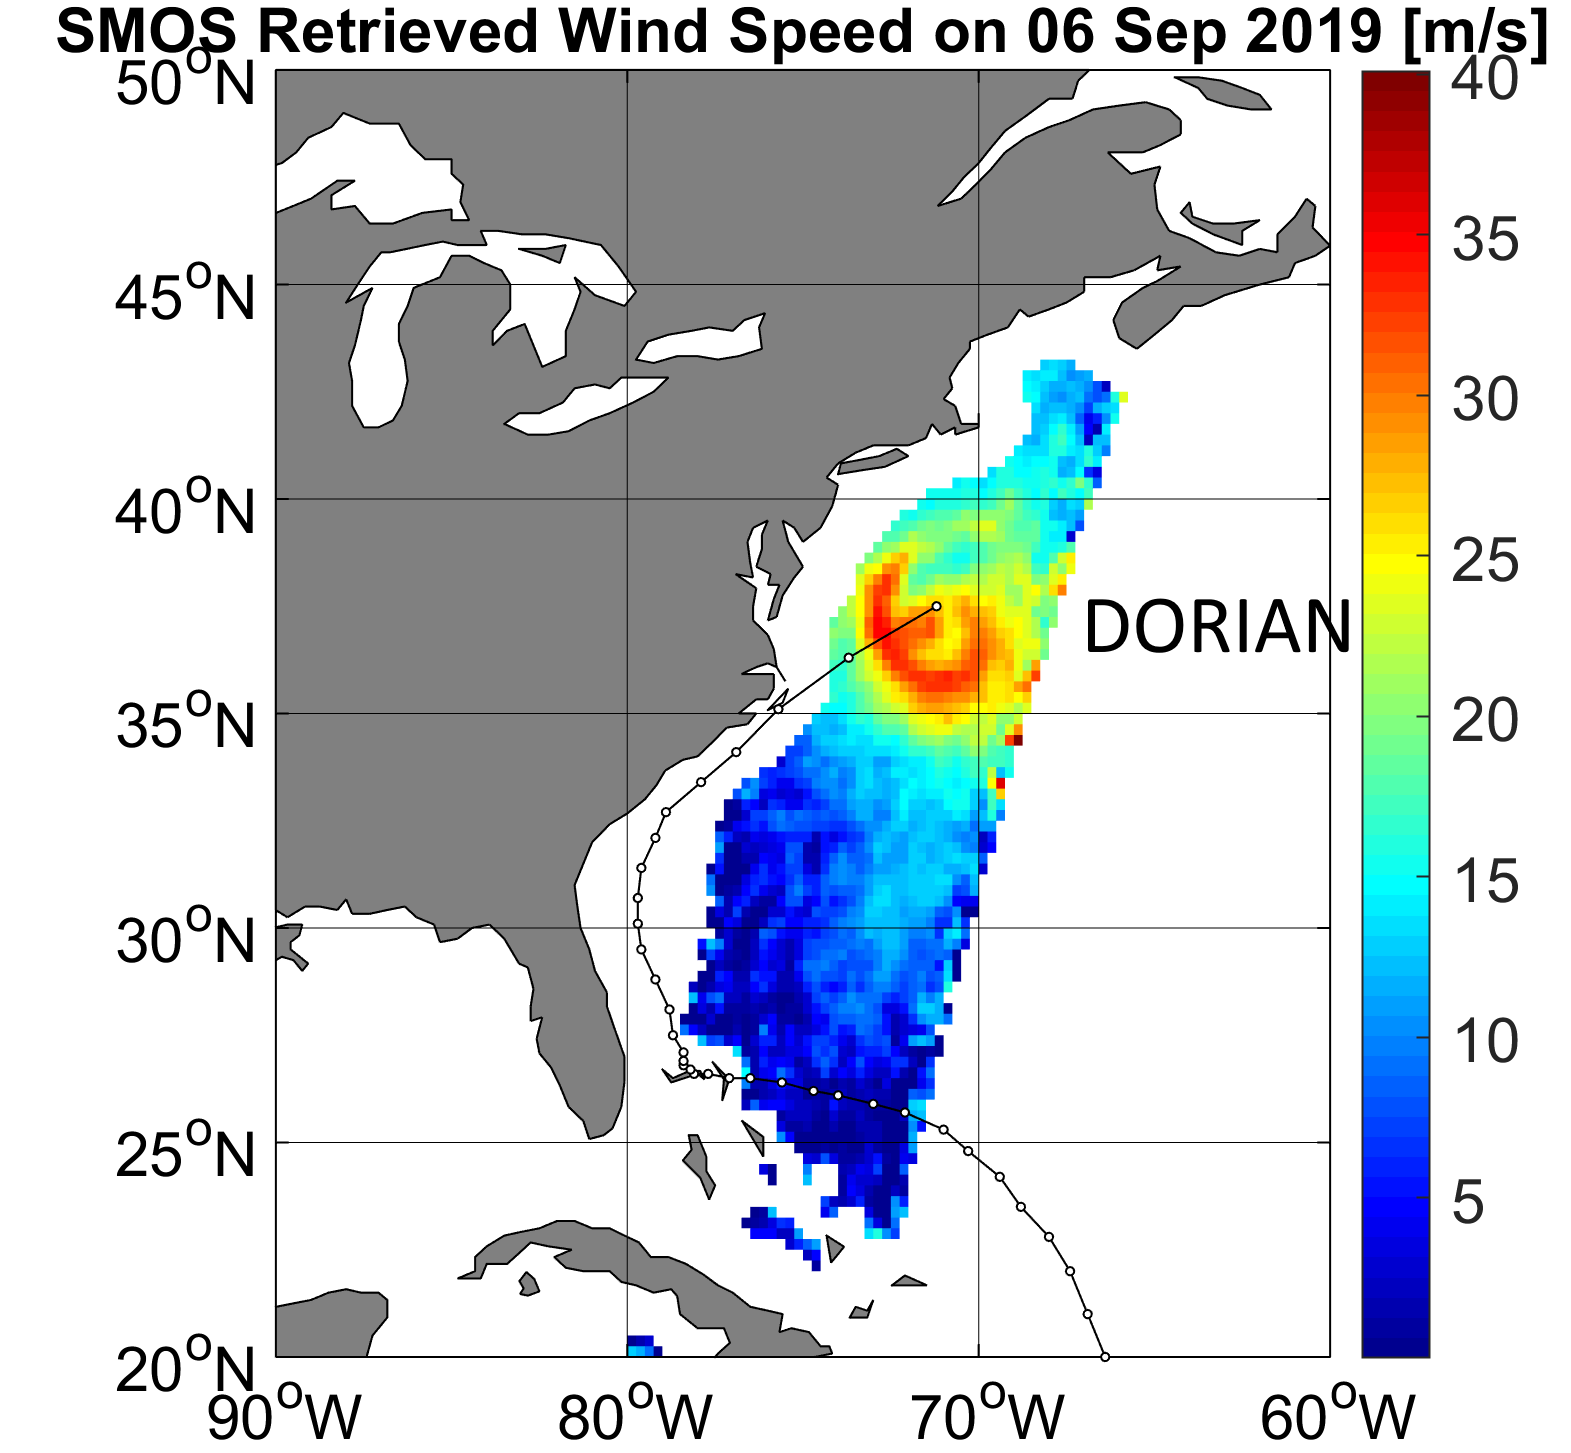
Fig 7: SMOS wind speed retrieval in m/s over Dorian and Juliette hurricanes on September 3 (left)
and over Dorian hurricane on September 6 (right). Credits ESA/Ifremer.
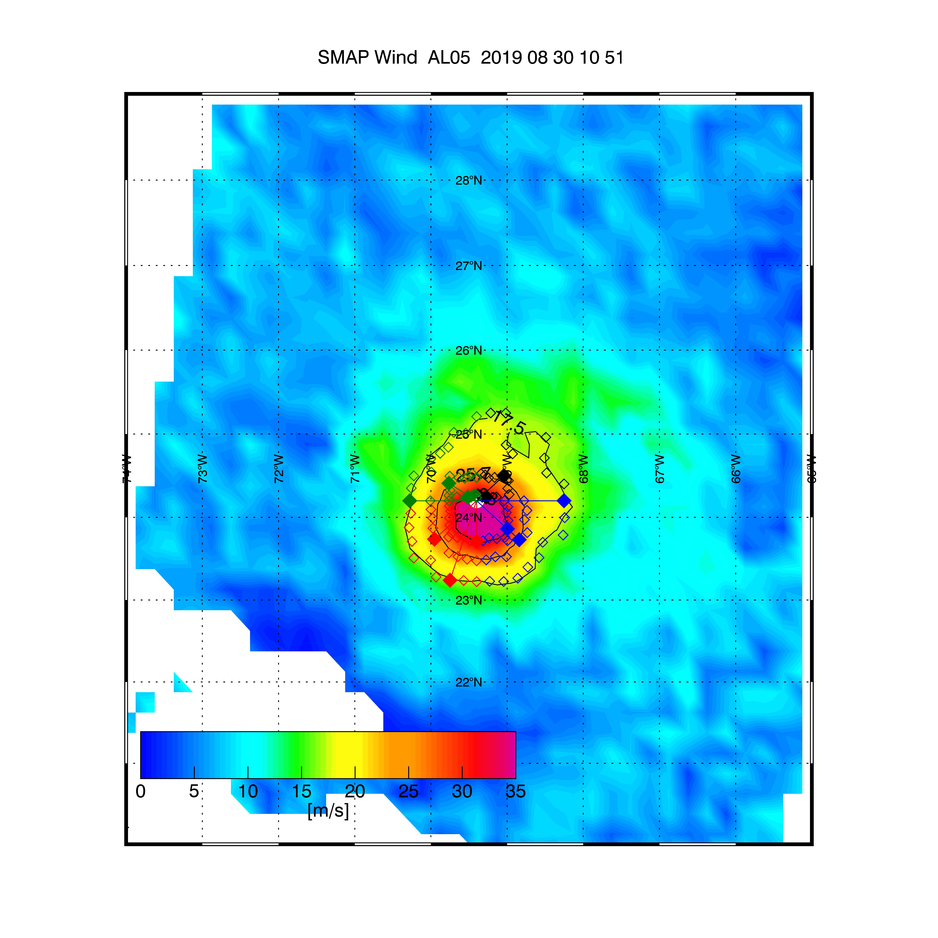
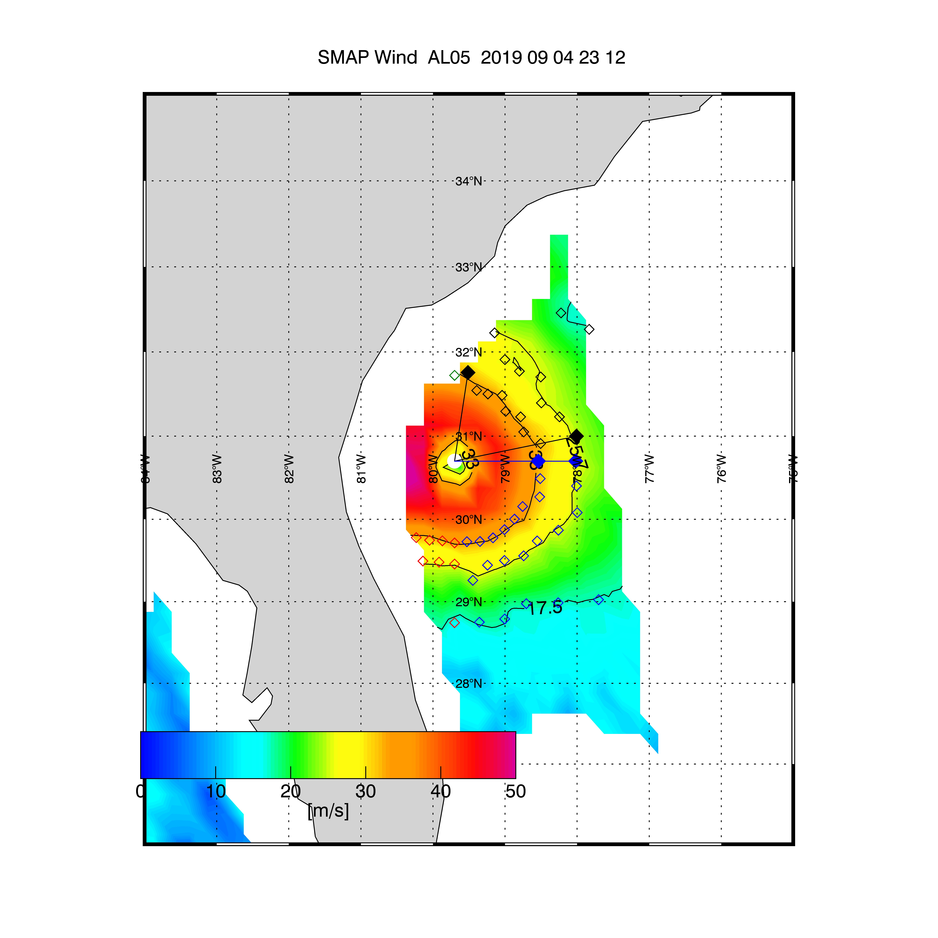
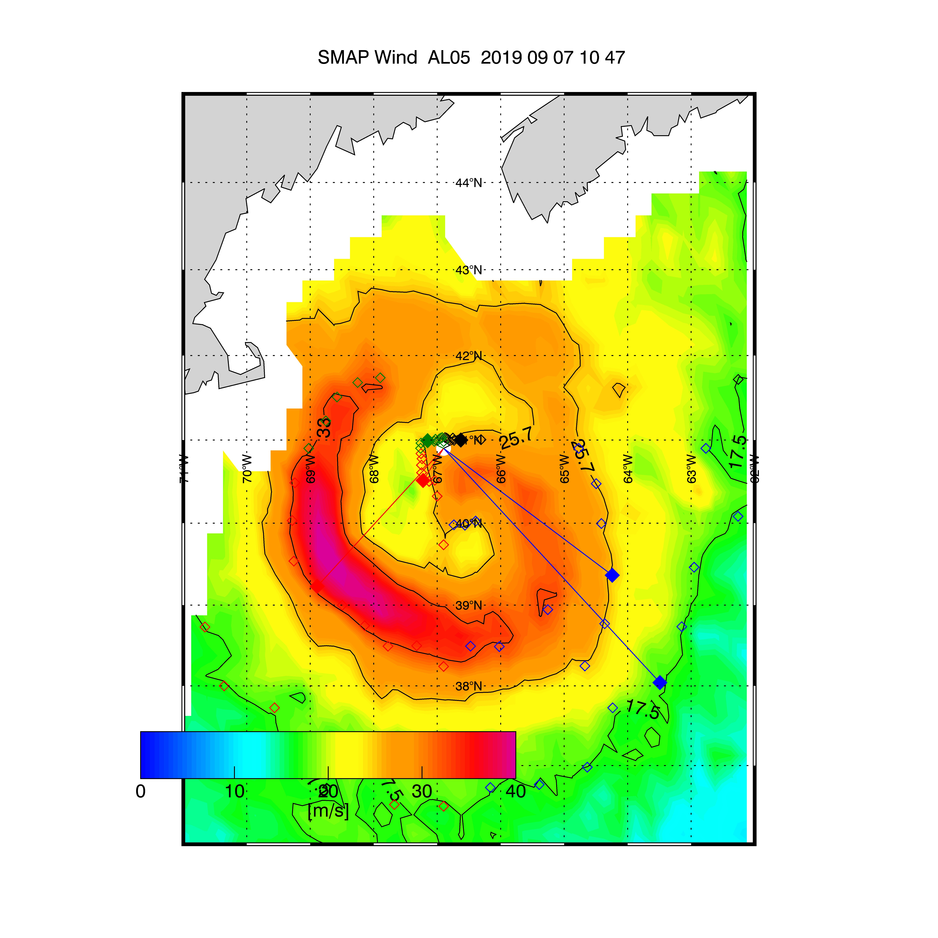
Fig 8: SMAP wind speed retrieval (m/s) over Dorian hurricane on August 31 (left), September 4 (middle) and September 9 (right). Credits REMSS.
Tropical Cyclone Heat Potential
Ocean heat is the fuel to develop and sustain hurricane. The ocean heat content called the Tropical Cyclone Heat Potential (TCHP) is the quantity of ocean heat available above the 26°C isotherm (minimum temperature required for cyclone generation) and gives information on water condition ahead of the hurricane and also shows the heat pumped from the ocean by the hurricane in its wake. The TCHP is calculated from temperature data from the global ocean model PSY4V3 developed by Mercator Océan International as part of the European Copernicus Marine Service. The hurricane positions and the maximum sustained winds were found on the NOAA site.
Further information:
- General
- Data access:
- CFOSAT L2 products will be soon distributed by Aviso+
- Copernicus Sentinel-3 Significant Wave Heights Level-2 Plus products from AVISO+ in collaboration with EUMETSAT.
- Jason-2/Jason-3/SARAL/AltiKa OGDRs products from AVISO+.
- Merged Significant Wave Heights with Jason-3, Sentinel-3A&B, Cryosat-2 and Saral/Altika, from Copernicus Marine Service, product WAVE_GLO_WAV_L4_SWH_NRT_OBSERVATIONS_014_003
- Copernicus Sentinel-1 and Sentinel-3 data from ESA website.
- Soil Moisture and Ocean Salinity data from ESA and Ifremer www.smosstorm.org
- Soil Moisture Active Passive from REMSS and NASA https://podaac.jpl.nasa.gov/SMAP, www.remss.com
- Cryosat-2 NOP products from ESA
- to compute the ocean energy content, PSY4-V3 model, 1/12° from Mercator Océan from Copernicus Marine Service, product GLOBAL_ANALYSIS_FORECAST_PHY_001_024
- hurricane positions and maximum sustained winds from NOAA
- Video Observing hurricanes and waves:
- Scientific references:
- Extreme winds with Sentinel-1 :
- Mouche Alexis, Chapron Bertrand, Knaff John, Zhao Yuan, Zhang Biao, Combot Clement (2019). Co-polarized and Cross‐Polarized SAR Measurements for High‐Resolution Description of Major Hurricane Wind Structures: Application to Irma Category 5 Hurricane. Journal Of Geophysical Research-oceans, 124(6), 3905-3922. https://doi.org/10.1029/2019JC015056
- A. Mouche, B. Chapron, B. Zhang and R. Husson, Combined Co- and Cross-Polarized SAR Measurements Under Extreme Wind, in IEEE Transactions on Geoscience and Remote Sensing, Vol. PP, Issue 99, pp1-10, 10.1109/TGRS.2017.2732508, 2017
- Winds retrieval from SMOS and SMAP:
- Reul Nicolas, Chapron Bertrand, Zabolotskikh E., Donlon C., Mouche Alexis, Tenerelli Joseph, Collard F., Piolle Jean-Francois, Fore A., Yueh S., Cotton J., Francis P., Quilfen Yves, Kudryavtsev V. (2017). A new generation of Tropical Cyclone Size measurements from space . Bulletin Of The American Meteorological Society , 98(11), 2367-2386 . Publisher's official version : doi.org/10.1175/BAMS-D-15-00291.1 ,
- Reul Nicolas, Chapron Bertrand, Zabolotskikh E., Donlon C., Quilfen Yves, Guimbard Sebastien, Piolle Jean-Francois (2016). A revised L-band radio-brightness sensitivity to extreme winds under tropical cyclones: The 5 year SMOS-Storm database . Remote Sensing Of Environment , 180, 274-291 . Publisher's official version : doi.org/10.1016/j.rse.2016.03.011
- Reul Nicolas, Tenerelli Joseph, Chapron Bertrand, Vandemark Doug, Quilfen Yves, Kerr Yann (2012). SMOS satellite L-band radiometer: A new capability for ocean surface remote sensing in hurricanes . Journal Of Geophysical Research-oceans , 117, - . Publisher's official version : doi.org/10.1029/2011JC007474
- Meissner, T., L. Ricciardulli, and F. Wentz, 2018: Remote Sensing Systems SMAP daily Sea Surface Winds Speeds on 0.25 deg grid, Version 01.0. [NRT or FINAL]. Remote Sensing Systems, Santa Rosa, CA. Available online at www.remss.com/missions/smap/
- Altimetry data: Carrère L, F. Mertz, J. Dorandeu, Y. Quilfen and J. Patoux, 2009: "Observing and Studying Extreme Low Pressure Events with Altimetry"
- Extreme winds with Sentinel-1 :

