Cyclone Freddy, February-March 2023
Cyclone Freddy, in February-March 2023, broke a number of records. It lasted the longest time ever recorded for a cyclone (typhoon or hurricane alike). It was also possibly the one which path was the longest in kilometers, with a strange course. Winds were strong - over 60 m/s at some point of the phenomenon. It caused life losses, and a great number of damages on Madagascar and on the African continent itself.
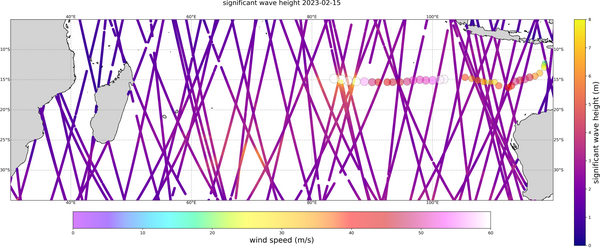
The figure above shows the Significant Wave Height measured by nine altimeters flying simultaneously on Feb. 15: Cryosat-2 (Esa), Saral (Cnes/Isro), HaiYang-2B & C (CNSA & CNSA/Cnes), Jason-3 (Cnes/Nasa/Eumetsat/Noaa), Copernicus Sentinel-3A&B (Esa/Eumetsat), CFOSat (Cnes/CNSA) and Sentinel-6 Michael Freilich (Esa/Eumetsat/EU/Cnes/Noaa/Nasa).
(see the animation of the whole 36 days of the phenomenon overlaid on SWH altimeters' data on Aviso YouTube channel)
CFOSat
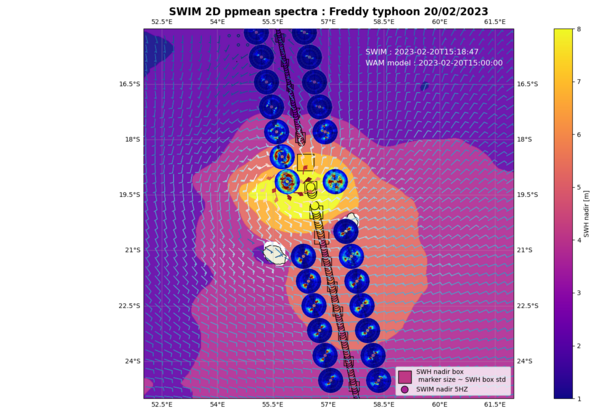
On Feb. 20, 2023, SWIM instrument onboard CFOSat caught a strong wind sea near the storm's eye correlated with strong wirling winds in the area.
Above 18°S, SWIM captures a little swell in the direction NW/SE correlated with the wind direction in the area. Going down to the South, wind direction is rotating and SWIM captures a stronger swell in the direction NE/SW induced by storm winds.
As Freddy is travelling from SW to E, area under islands is on the back of Freddy's way so wind strength and SWH are higher.
Cyclone intensification
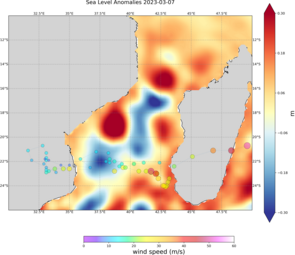
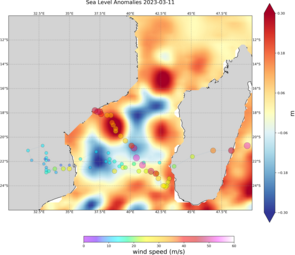
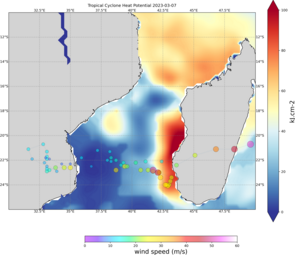
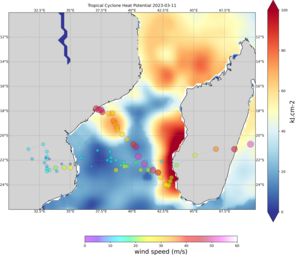
As it was seen in the Gulf of Mexico (e.g. for Katrina in 2005), cyclones can intensify when going over warm ocean features. Freddy had spent a long time in the Mozambique Channel, an area with active mesoscale circulation -- and it has been reinforced on at least two periods. Tropical Cyclone Heat Potential from Noaa/AOML seems to corroborate the visual correlation made with Sea Level Anomalies.
View the SLA and the TCHP animations on Aviso YouTube channel
SAR-imagery of high winds
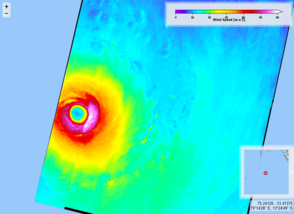
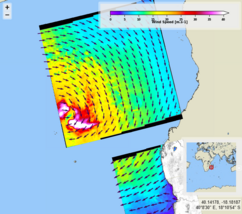
Several Synthetic Aperture Radar (SAR) images were acquired with the Copernicus/ESA Sentinel-1A mission during Freddy's lifetime.
The high-resolution map of the sea surface wind field is derived from the backscatter measurements by combining both the vertical and horizontal polarizations (VV and VH) of the SAR instrument (see plot above using the methodology described in the dedicated paper [Mouche et al, 2019]).
Thanks to the ESA initiative toward the spaceborne monitoring of Tropical Cyclones, the Satellite Hurricane Observation Campaign (SHOC) consists in a joint effort between the Sentinel-1 mission planning team, IFREMER and CLS. Once an alert is raised, the acquisition plan of Sentinel-1 A mission is modified on short notice to capture the cyclonic event over the oceans before landfall including open ocean and coastal areas. All information and data on the CYMS website (CYclone MOnitoring Service).
