Python visualization tools for CFOSAT SWIM L1A/L1B/L2 products
Some examples of Jupyter notebooks are given below. A complete description of tools and variables used are described in the SWIM Products Simplified Handbook. All the examples below are grouped in a zip file for easier downloading.
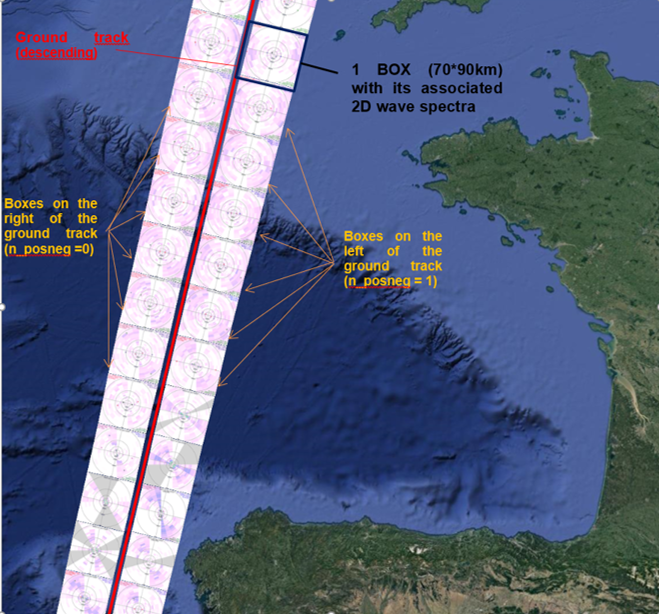
The wave spectra parameters are given by box (SWIM Quick Handbook). The spatial distribution of these boxes is reminded on the figure below.
In one L2 Product file there are n_box * n_posneg wave spectra.
The parameters for wave spectra can be divided in three parts:
- The Omni-directional spectra,
- The 2D directional wave spectra,
- Their associated wave parameters and partitions.
These parameters are computed based on measurements performed with the 6°, 8° and 10° beams, which are called the spectral beams.
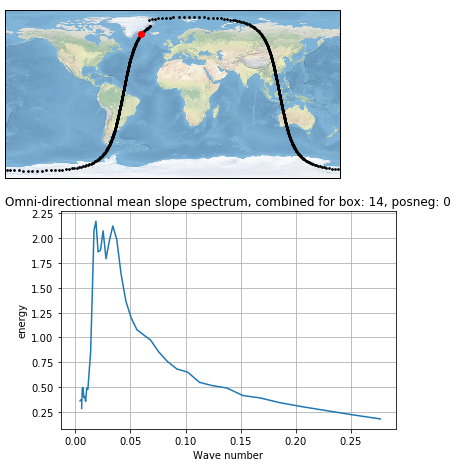
Omnidirectional wave slope spectra
For each box omnidirectional spectra are given as a function of the wave number
Visualization tool: CFOSAT_SWIM_omini-dir_spectrum_visu.ipynb (download not supported by IE)
2D wave spectra
The wave spectra are given through a polar representation wave spectra = f(wavenumber,azimuth): In one box, each sample value of spectra is given for one wavenumber and one azimuth.
Visualization tool: CFOSAT_SWIM_2D_wave_spectrum_visu.ipynb and plot_spectre_2D.py (download not supported by IE)
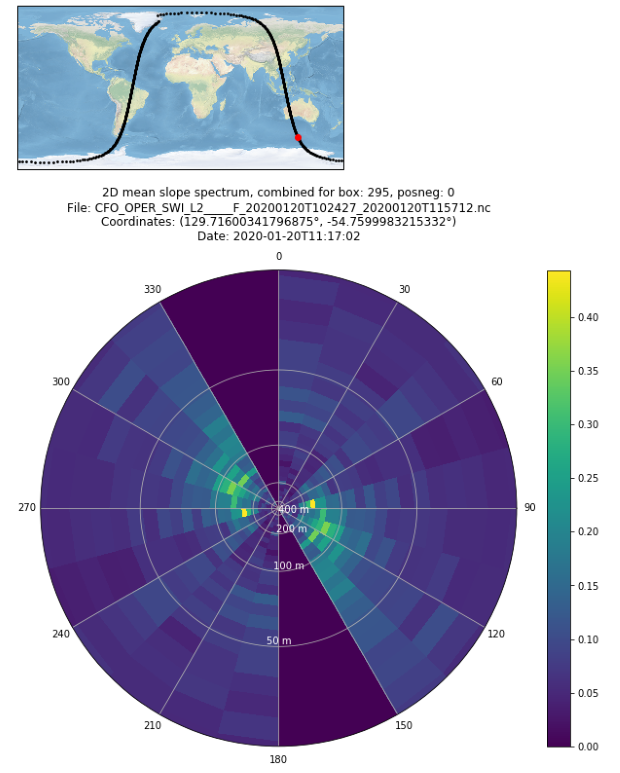
left: box localization and raw wave slope spectra when partitions vizualisation is not activated,
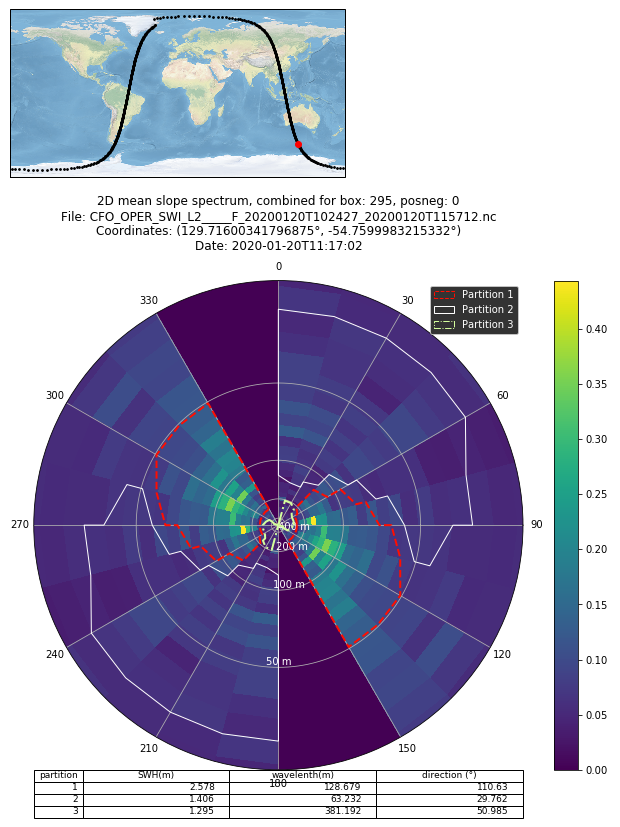
right: box localization and raw wave slope spectra, the partitions and the associated parameters when the partitions vizualisation is activated
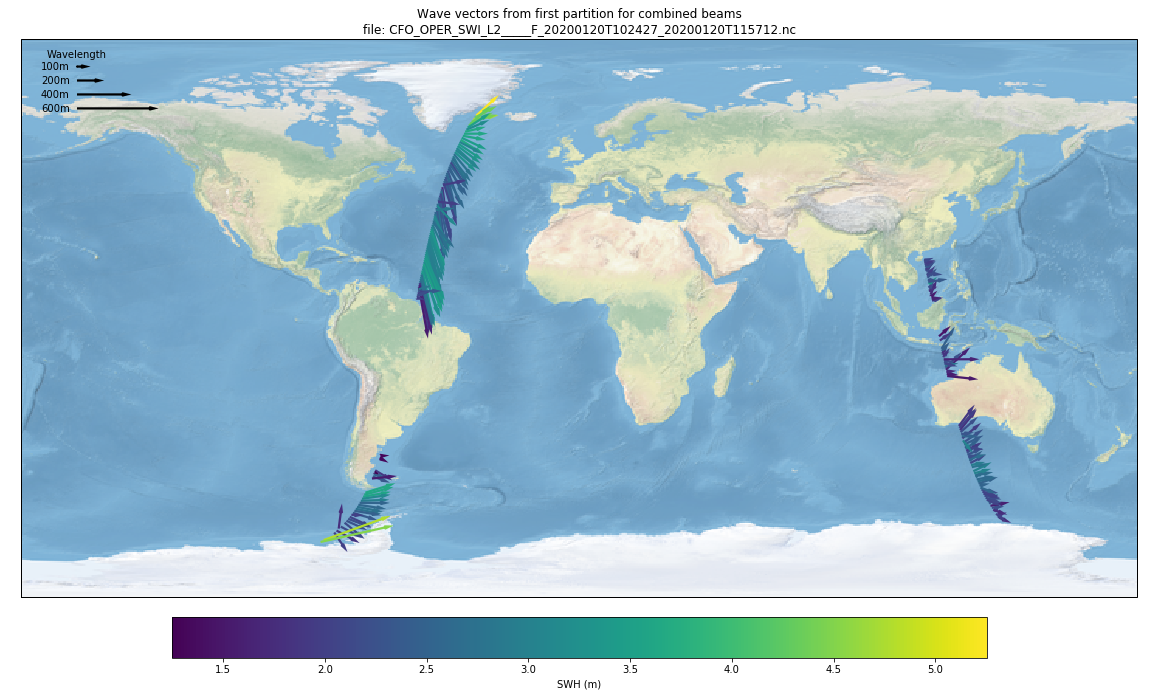
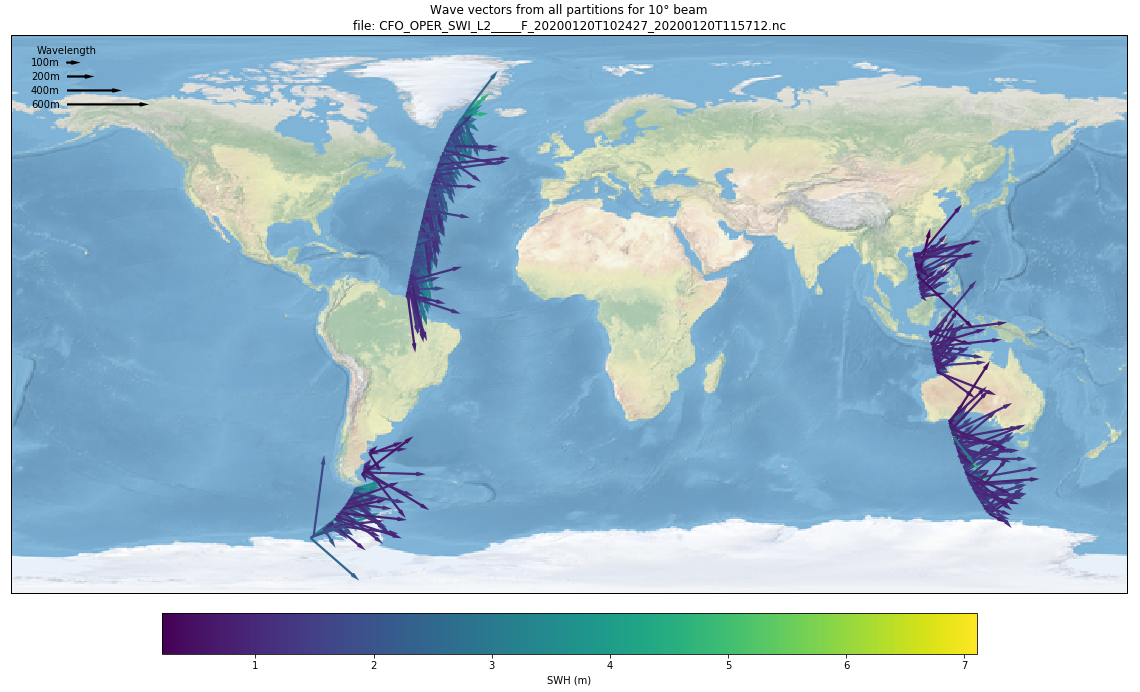
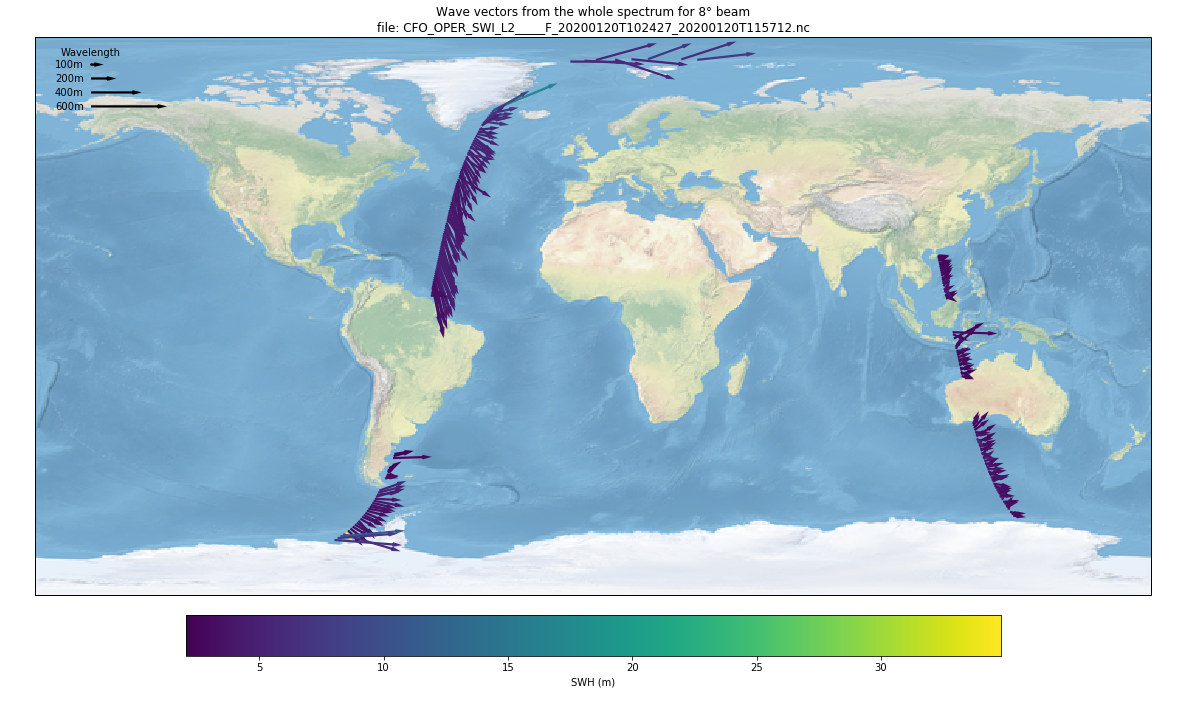
Wave parameters
Definitions:
3 wave parameters are given for each box:
- The Significant Wave Height given, in meter
- The dominant wavelength given, in meter
- The dominant direction given in the meteorological convention with a 180° ambiguity (0°= from or towards North or from South, 90°= from or toward East or from West, 180°= from or towards South, 270°= from or towards west
Visualization tool: CFOSAT_SWIM_wave_param_visu.ipynb (download not supported by IE)
Sigma0 parameters
Visualization tool: CFOSAT_sigmao0_visu.ipynb and CFOSAT_visu_mini_prof_sigma0.ipynb (download not supported by IE)

